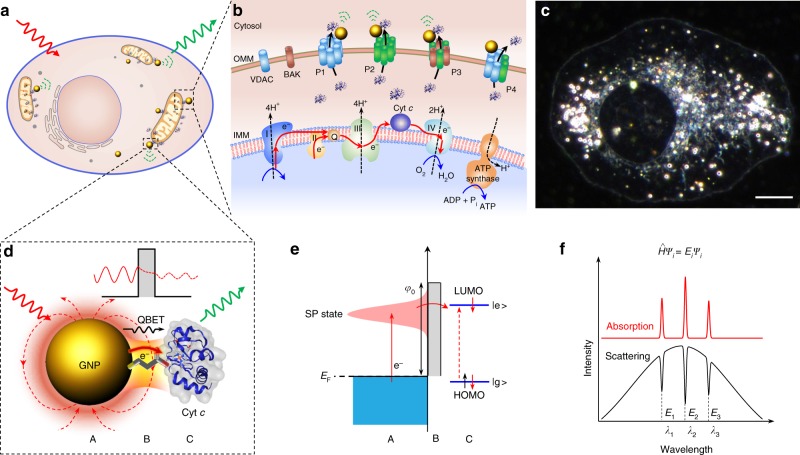
Fig. 1.
QBET imaging in a tunnel junction. a Schematic of GNPs used as optical antennas for intracellular QBET imaging in living cells. b Schematic illustration of GNPs for the detection of Cyt c released from mitochondria to cytosol. Cyt c is originally involved in the electron transport chain on the inner mitochondrial membrane (IMM), and transfers electrons between complexes III (Cyt c reductase) and IV (Cyt c oxidase, COX). After the formation of different pores or channels on outer mitochondrial membrane (OMM), Cyt c is released through these pores to cytosol. P1 to P4 represent pores based on oligomeric voltage-dependent anion channels (VDAC), BAX oligomer, BAX-BAK oligomer, and VDAC-BAX oligomer, respectively. BAX and BAK are two B-cell lymphoma protein-2 (BCL2) effector proteins. c A representative dark-field image of a living cell with GNP uptake. Scale bar: 10 µm. d Schematic of QBET in A/B/C tunnel junction. Single GNP acts as an Au plasmonic optical antenna (A) with light irradiation. Surface electrons collectively oscillate at the resonant light frequency. Electrons tunnel through the potential barrier via linker molecule (barrier molecular, B) to Cyt c (C). e Schematic illustration of electron tunnelling in the A/B/C tunnel junction. Electron is excited from Fermi level (EF) to a surface plasmon (SP) state, and tunnels through the potential barrier via the barrier molecule to Cyt c. The molecule is excited to the excited state (|e > ) after the electron tunnelling and transfer. |e > : excited state, |g > : ground state, LUMO: lowest unoccupied molecular orbital, HOMO: highest occupied molecular orbital. f Scattering spectra with quantised dips for QBET imaging. QBET results in quantised dips in the scattering spectra of GNP, which matches the frequencies of electronic transitions of Cyt c (absorption peaks). These dips correspond to the quantised eigenvalues Ei at the electron state ψi in the tunnelling process. The cartoons for Cyt c molecules in a, b and d were created from the RSCB protein data bank54

