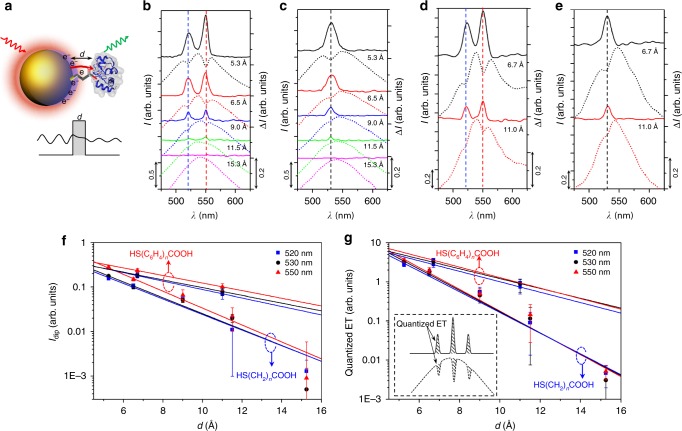
Fig. 2.
Tunnelling behaviour with different barrier width. a Schematic of electron tunnelling in A/B/C tunnel junction with variable barrier width d. The cartoon for Cyt c molecule was created from the RSCB protein data bank54. b–e Scattering spectra and spectra difference for QBET imaging in (b, d) A/B/C (Red.) and (c, e) A/B/C (Ox.) tunnel junction with (a, b) HS(CH2)nCOOH and (c, d) HS(C6H4)nCOOH of different barrier widths as linker molecules. The quantised peaks were obtained from the difference of scattering spectra between the GNP-Cyt c conjugation and the linker molecule modified GNP without Cyt c. Dashed curves are captured scattering spectra (linked to left axis) of GNP-Cyt c conjugation, and solid curves are the corresponding spectra difference (linked to right axis). Blue and red dashed lines in b, d indicate the quantised dips (peaks) at 520 and 550 nm, respectively, while the black dashed lines in c, e indicate the dips (peaks) at 530 nm. f Dip depth (Idip) as a function of barrier width with exponential fitting. The red dashed circle with an upwards arrow and blue dashed circle with a downwards arrow indicate the two groups of data are for HS(C6H4)nCOOH and HS(CH2)nCOOH, respectively. g Quantised ET as a function of barrier width, experimental data are fitted using the quantum tunnelling equation. Inset shows the schematic of accumulated quantised ET from the integral of the dips in the scattering spectra. Error bars represent standard deviation

