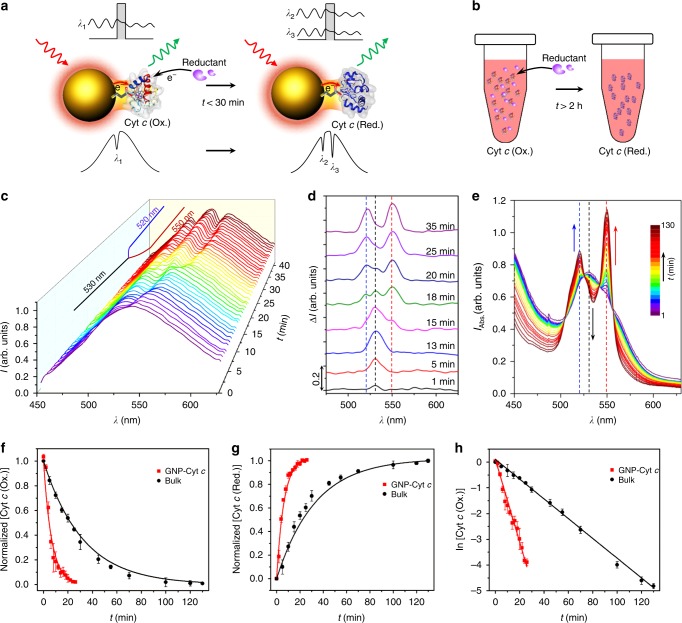
Fig. 3.
Real-time QBET imaging during Cyt c reduction. a Schematic for QBET imaging during Cyt c reduction in A/B/C tunnel junction, with a total reaction time of less than 30 min. With reductant added, Cyt c (Ox.) is reduced to Cyt c (Red.), and the electron tunnelling through the barrier changes from λ1 (530 nm) to λ2 (520 nm) and λ3 (550 nm). b Schematic for Cyt c reduction in bulk solution with a total reaction time of larger than 2 h. c Real-time scattering spectra of GNP-Cyt c conjugation in the whole Cyt c (Ox.) conjugating and reduction process, QBET in the reduction process is captured from the spectra dip changes which were splitted from 530 nm to 520 and 550 nm. d Representative scattering spectra difference (compared with the GNP without Cyt c at t = 0) in the reduction process showing the dip changes at different time. e Absorption spectra of Cyt c bulk solution during the reduction process. The absorption peak of 530 nm (dashed black line) for Cyt c (Ox.) is gradually decreased, while the peaks of 520 (dashed blue line) and 550 nm (dashed red line) for Cyt c (Red.) are gradually increased. f Normalised Cyt c (Ox.) concentration during the reduction process in both GNP-Cyt c conjunction and bulk solution. g Normalised Cyt c (Red.) concentration during the reduction process. h Plot of ln [Cyt c] in the reduction process with linear fit. The cartoons for Cyt c molecules in a and b were created from the RSCB protein data bank54. Error bars represent standard deviation

