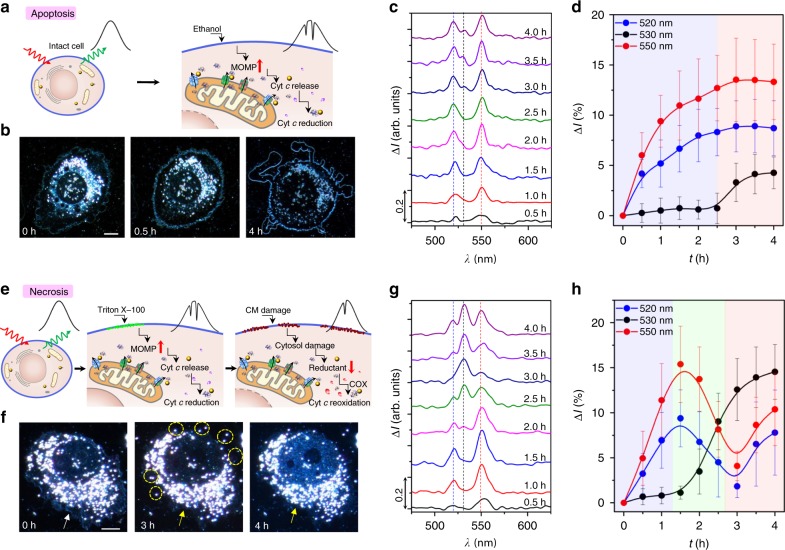
Fig. 4.
Real-time intracellular QBET imaging of ET during cellular apoptosis and necrosis. a–d, Non-invasive QBET imaging for cell apoptosis. a Schematic of cellular stimulus with ethanol for apoptosis. Major QBET signals for Cyt c (red.) are captured during apoptosis. MOMP: mitochondrial outer membrane permeabilisation. b Dark-field images of the cell at different time with the stimulus of ethanol, scale bar: 10 μm. t = 0 h, the beginning of apoptosis measurement. t = 0.5 h, cell shrinkage was observed. t = 4 h, nucleus was ruptured and apoptosis bodies was formed. c Scattering spectra difference showing QBET in A/B/C tunnel junction in the process of cell apoptosis, data obtained from region VIII in Supplementary Fig. 9. The QBET spectra differences were obtained by subtracting the spectra at different measuring times from the spectra at the beginning of the measurement (t = 0 h). d Quantised dips at 520, 530 and 550 nm in the process of cell apoptosis. e–h QBET imaging with triton X-100 stimulus for cell necrosis. e Schematic of cellular stimulus with triton X-100 for necrosis. QBET is captured from Cyt c (red.) to Cyt c (Ox.) during necrosis. CM: cell membrane, COX: Cyt c oxidase. f Dark-field images of the cell with the stimulus of triton X-100. t = 0 h, white arrow indicates the intact cell membrane; t = 3 h, yellow arrow indicates partial lysis of cell membrane, yellow circles indicate organelles are released out to extracellular environment; t = 4 h, yellow arrow indicates the damage and lysis of the whole membrane. Scale bar: 10 μm. g Scattering spectra difference showing QBET in the process of cell necrosis, data obtained from GNP in region I in Supplementary Fig. 14. The dip changes show the change from Cyt c (Red.) to Cyt c (Ox.), and finally both Cyt c (Red.) and Cyt c (Ox.). h, Quantised dips at 520, 530, and 550 nm in the process of cell necrosis with cyclic behaviour. The curves in d, h are cubic B-spline connection of the experimental data (Supplementary Note 6). The cartoons for Cyt c molecules in a, e were created from the RSCB protein data bank54. Error bars represent standard deviation

