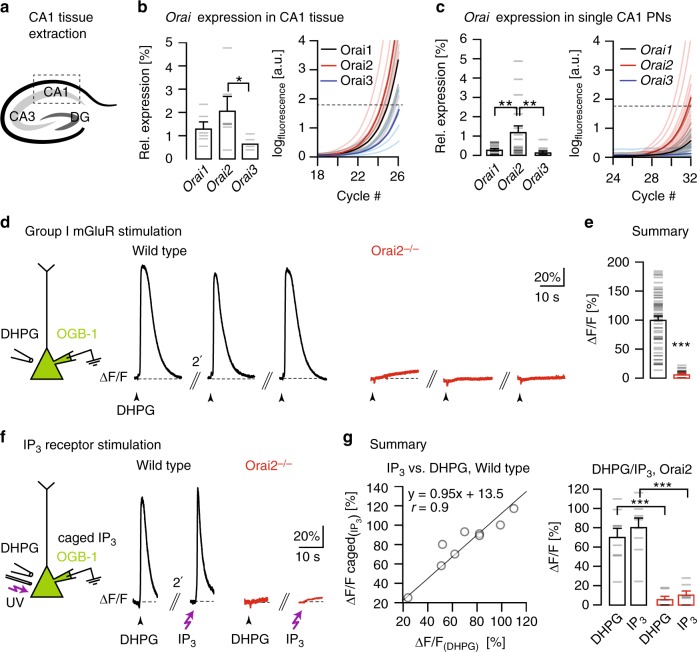
Fig. 1.
Orai2 is required for IP3R-dependent Ca2+ release from internal stores. a Schematic depiction of the hippocampus with the three regions CA1, CA3, and the dentate gyrus (DG). CA1 tissue was extracted for quantitative reverse transcription-PCR. b Result of Orai PCR analysis in the mouse hippocampus (P18). Left: Mean expression levels of the three Orai homologs relative to the housekeeping gene Gapdh (n = 6 mice, p = 0.024 (analysis of variance)). Gray dashes represent individual values in this and other figures. Right: Real-time monitoring of the fluorescence emission of SYBR Green I during the PCR amplification of Orai1-3 cDNA. Dashed line: noise band. c Analogous PCR analysis in single CA1 pyramidal neurons (PNs) harvested from acute hippocampal slices. Orai1: n = 21, Orai2: n = 19, Orai3: n = 15 cells; p = 0.002 (Orai1–Orai2), p = 0.001 (Orai2–Orai1). d Left: DHPG was pressure-applied to somata of whole-cell patch-clamped CA1 PNs filled through the patch pipette with OGB-1. Black traces: Ca2+ transients in CA1 PNs in a wild-type mouse (left) in response to repeated applications of DHPG (500 µM, 200 ms) at 2-min intervals. Red traces: Analogous experiments in an Orai2−/− mouse. e Mean amplitudes of DHPG-evoked Ca2+ transients in wild-type and Orai2−/− mice (n = 62 and 33 cells, respectively; p = 9.84 × 10⁻²⁴). f Left: Both ultraviolet light pulses and local DHPG puffs were applied to somata of whole-cell patch-clamped CA1 PNs filled with OGB-1 and NPE (“caged”)-IP3 through the patch pipette. Black traces: Fluorescence transients resulting from photolysis of caged IP3 (left) and local DHPG puff application (right) in the same cell in a wild-type mouse. Red traces: Analogous experiment in an Orai2−/− mouse. g Left: Correlation plot of relative fluorescence changes in response to IP3-uncaging (y axis) against relative fluorescence changes in response to DHPG applications (x axis) in the same cells in the wild type. Right: Mean amplitudes of relative fluorescence changes in response to both treatments in c in both genotypes (n = 9 cells in wild type and 7 cells in Orai2−/− mice, p = 1.74 × 10⁻⁴, p = 3.5 × 10⁻⁴). * - significant (p < 0.05), ** - very significant (p < 0.01), *** - highly significant (p < 0.001)

