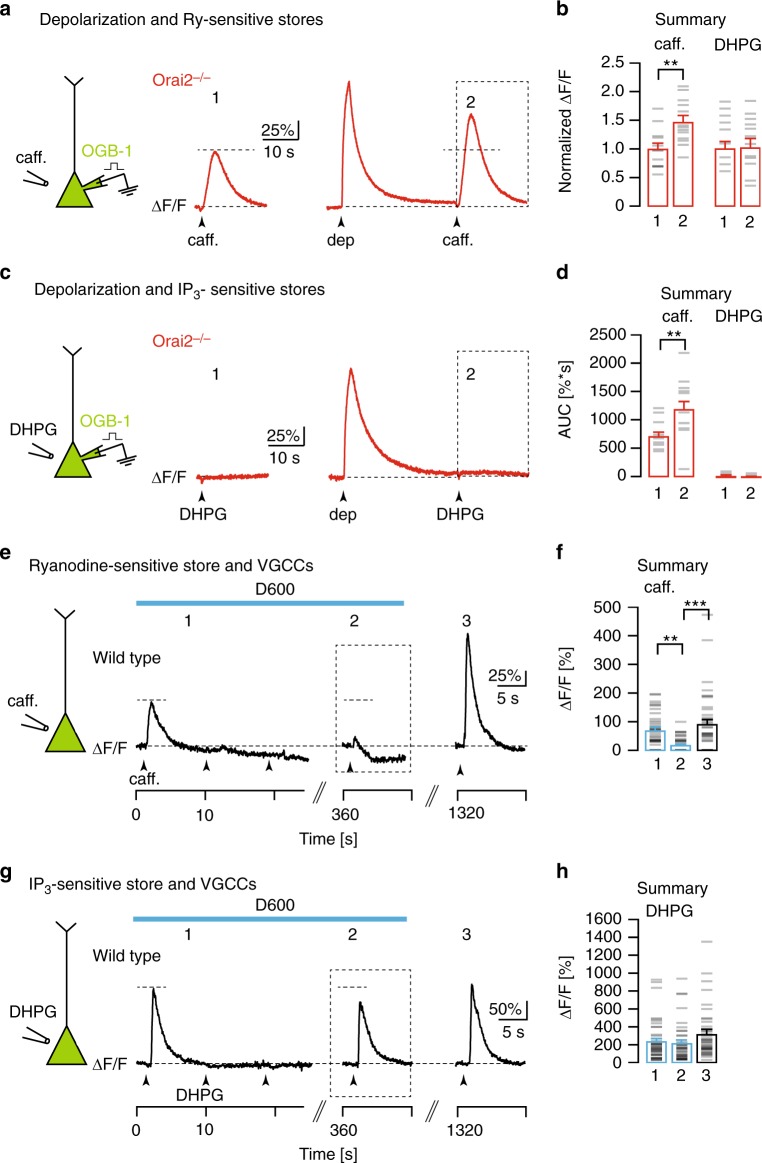
Fig. 3.
Orai2-independent replenishment and overcharging of Ry-sensitive Ca2+ stores. a Left: Caffeine was locally applied to the somata of whole-cell patch-clamped CA1 pyramidal neurons (PNs) filled with OGB-1 through the patch pipette. Red traces: Fluorescence recordings in an Orai2−/− mouse in response to applications of caffeine before (1), and 30s after (2) a depolarization to 0 mV for 1 s. b Summary of the experiments shown in a (left bars) and c (right bars). Bar graph showing mean amplitudes of relative fluorescence changes in response to caffeine (a, n = 13 cells, p = 0.0014) or 3,5-dihydroxyphenylglycine (DHPG; c, n = 17 cells, p = 0.65) application before (1) and after the depolarization (2), normalized to the control amplitude (1). c Analogous experiment in another CA1 PN from the same mouse with DHPG applied after the depolarization. d Mean area under the curve for 15 s following the caffeine (2) and DHPG (3) applications following the depolarization (marked by dashed boxes in a and b, caffeine: p = 0.01, DHPG: p = 0.831). e Left: Caffeine was locally applied to somata of CA1 PNs filled with Cal520-AM by multi-cell bolus loading (MCBL). Traces: Fluorescence recordings from the soma of a single CA1 PN in a wild-type mouse during consecutive caffeine applications (arrowheads) in the presence of D600 (blue bar) and after washout of D600. f Summary of the experiments shown in e. Mean amplitudes of relative fluorescence changes in response to caffeine applications at the time points indicated in e (n = 41 cells, analysis of variance (ANOVA): p = 0.001 (1 vs 2) and p = 4.98 × 10⁻⁶ (2 vs 3). g Analogous experiment to e with DHPG instead of caffeine applications. h Analogous summary to f for the experiments shown in g (n = 41 cells, ANOVA: p = 0.694 (1 vs 2) and p = 0.058 (2 vs 3)). ** - very significant (p <= 0.01), *** - extremely significant (p <= 0.0001)

