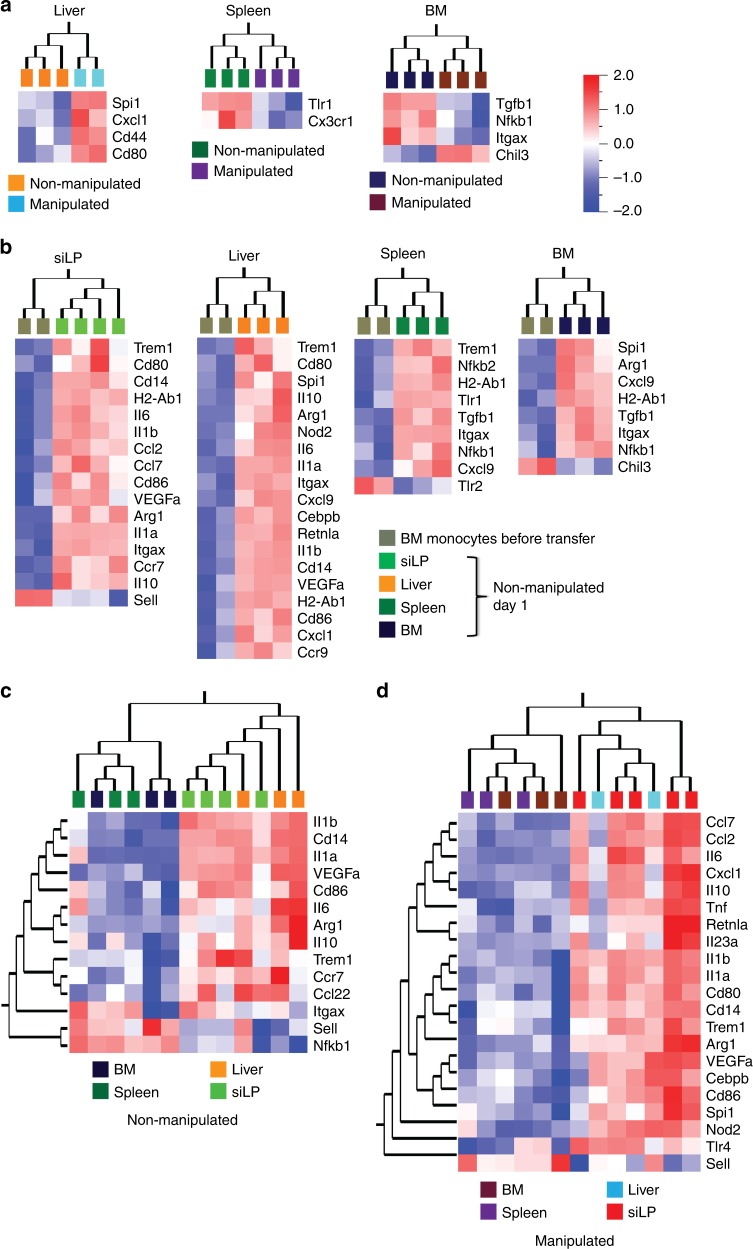
Fig. 6.
Tissue-specific signals instruct local monocyte adaptation. a Heat map showing gene expression profiles of donor monocytes recovered one day after transfer from liver, spleen, and BM comparing non-manipulated and manipulated recipients. b Gene expression profiles comparing donor BM monocytes before transfer with donor monocytes recovered from small intestine, liver, spleen, or BM of non-manipulated recipient at day 1 after transfer. c, d Comparison of gene expression profile of donor monocytes recovered at day 1 after transfer between small intestine, liver, spleen and BM of non-manipulated (c) and manipulated (d) recipients. Transcriptomic analysis was performed using nanostring nCounter analysis and differentially expressed genes were determined by Qlucore Omics explorer with a statistical significance p-value of 0.05. Data were pooled from 2–3 independent experiments with a total of 2–4 mice as indicated in each section of the figure

