
Fig. 3.
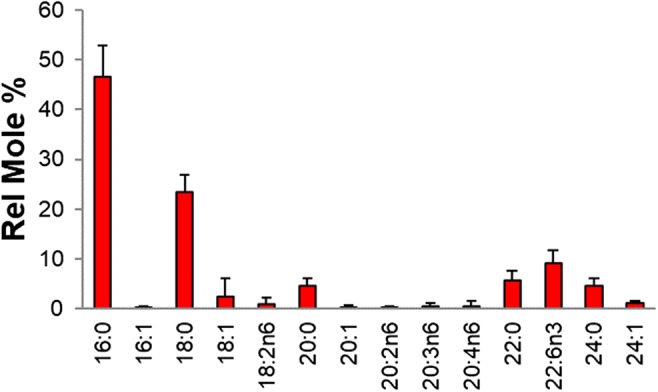
Fatty acid profile of sperm pellet total lipid extract (n = 70). Values are relative mole percent of each species ± standard deviation. The number to the left of the colon represents the number of carbons in the fatty acid and the number to the right of the colon represents the number of double bonds in the fatty acid