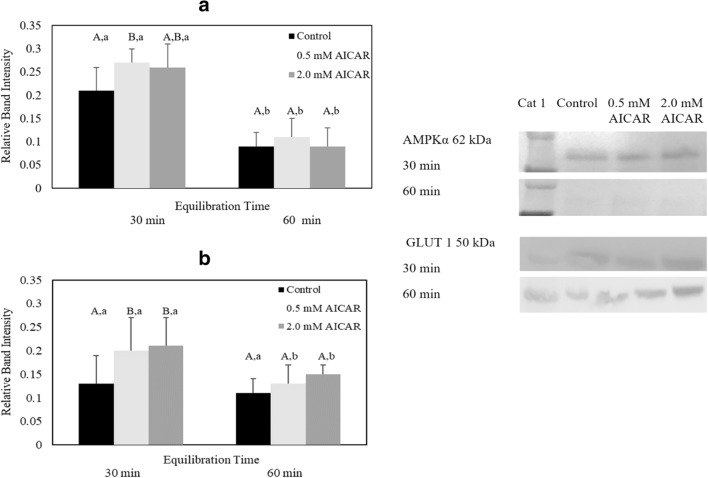
Fig. 3.
Relative band intensity of (A) phospho-AMPKα Thr172 protein (n = 6 cats) and (B) GLUT1 protein (n = 6 cats) in epididymal cat spermatozoa equilibrated with 0.5 or 2.0 mM AICAR for 30 or 60 min before cryopreservation (values expressed as mean ± SD). Within the same equilibration time, values with different uppercase letters are statistically different (P ≤ 0.05). For a given treatment, values with lowercase letters between equilibration times are statistically different (P ≤ 0.05). Western blot bands represent AMPKα signaling protein expression from one selected cat

