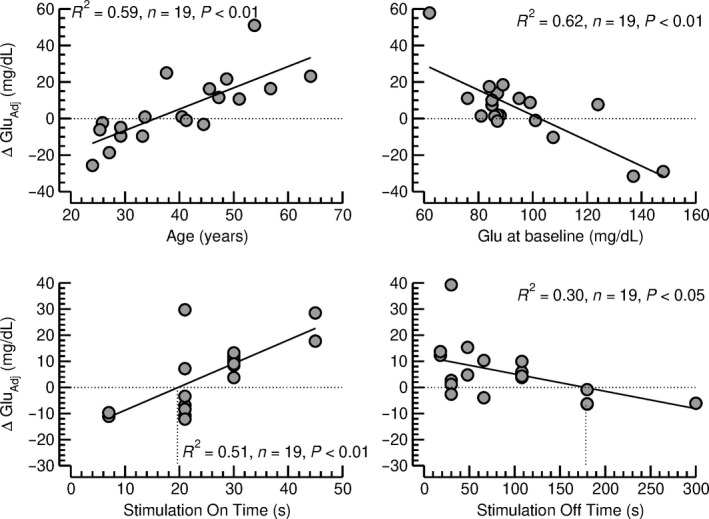
Figure 4.

Top row: Effect of age at stimulator implantation (left) and nonfasted blood glucose concentration at baseline (Glu, right) on changes in nonfasted blood glucose concentration from baseline to follow‐up, adjusted for the respective other confounding factor (ΔGluAdj) according to the multiple linear regression analysis shown in Table 2a. Bottom row: Effect of the stimulation on time (left) and stimulation off time (right) on the change in nonfasted blood glucose concentration from baseline to follow‐up, adjusted for the nonfasted blood glucose concentration at baseline and for the age at stimulator implantation (ΔGluAdj). Significant linear correlations were found between both stimulation parameters and ΔGluAdj. The intersections of the linear trend lines with the zero axes, were located at 20 sec for the stimulation on time and at 179 sec for the stimulation off time.
