
Figure 5.
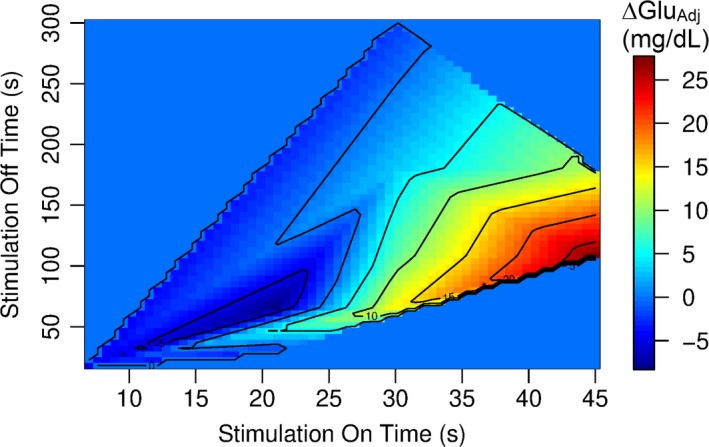
Relationship between stimulation on time (x‐axis), stimulation off time (y‐axis) and change in nonfasted blood glucose concentration from baseline to follow‐up, adjusted for the nonfasted blood glucose concentration at baseline and for the age at stimulator implantation (ΔGluAdj, color coding). The color coding refers to ΔGluAdj values in mg/dL shown in the legend on the right side of the graph.