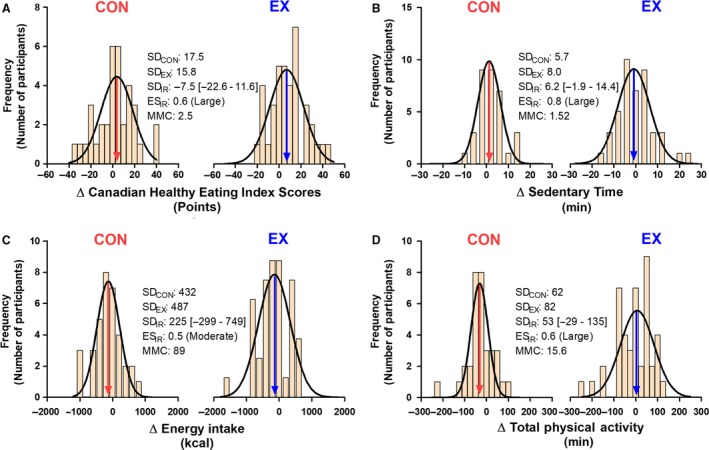
Figure 3.

Histograms depicting variability in changes in behavioral factors that are known to influence overall health and fitness following the completion of 24 weeks of exercise training (EX) or a control period (CON). All data were collected from a previously published randomized controlled trial (Ross et al., 2015). Variability in changes in Canadian Healthy Eating Index Scores (A), sedentary time (B), energy intake (C), and total physical activity (D). The EX and CON groups presented in this figure are the same groups presented in Figure 1. See Ross et al. (2013) for more information regarding the measurement of these behavioral outcomes. SDCON and SDEX values represent the variability in observed responses to CON and EX, respectively. SDIR values were calculated using equation 8. Negative SDIR values reflect situations where SDCON exceeded SDEX, and SDIR was therefore calculated by switching SDCON and SDEX in equation 8. As recommended by Hopkins (Hopkins, 2015), effect sizes of SDIR values (ESIR) were calculated by dividing SDIR values by baseline SD (see Hopkins (2015) for effect size category cut‐points). As previously recommended (Hopkins et al., 2009; Swinton et al., 2018; Hecksteden et al., 2018), minimum meaningful change (MMC) thresholds were determined by multiplying baseline SD by 0.2. The arrows indicate the mean observed response for each behavioral variable.
