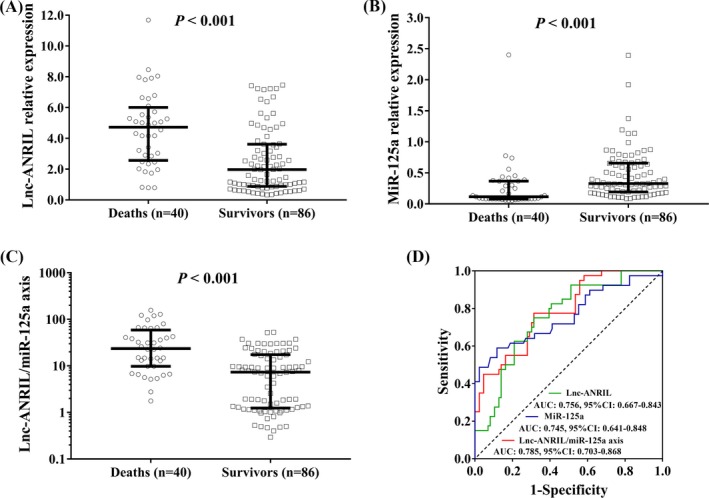
Figure 3.

The predictive value of lnc‐ANRIL/miR‐125a axis for 28‐day mortality. Plasma lnc‐ANRIL (A) and lnc‐ANRIL/miR‐125a axis (C) levels were upregulated, while miR‐125a expression (B) was decreased in plasma in deaths than those in survivors. ROC curve analyses illuminated that lnc‐ANRIL, miR‐125a, and lncARIL/miR‐125a expressions were capable of differentiating deaths from survivors (D). Comparison between two groups was determined by Wilcoxon rank‐sum test. Variables' diagnostic value for sepsis and predicting value for death were assessed by ROC curve and the derived area AUC P value < 0.05 was considered as significant. ANRIL, antisense noncoding RNA in the INK4 locus; AUC, area under the curve; ROC, receiver operating characteristic
