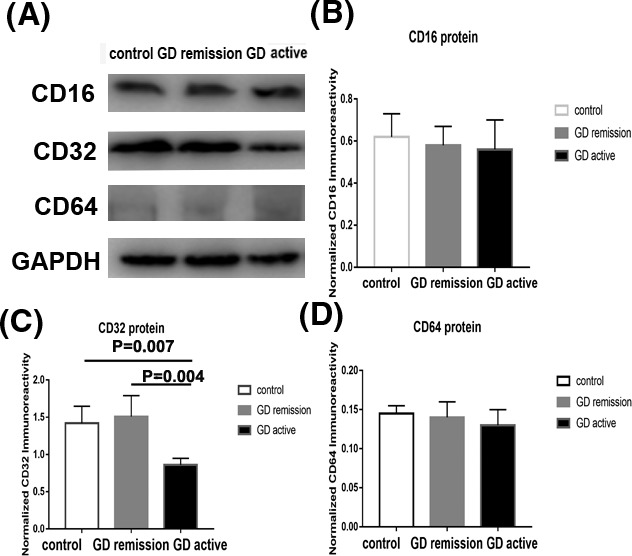
Figure 1.

Protein expression of FcγRI (CD64), FcγRII (CD32), and FcγRIII (CD16) on peripheral blood mononuclear cells (PBMCs) from Grave' disease (GD) in active and in remission and controls by Western blotting. A, Western blot analysis of CD16, CD32, and CD64 expression in PBMCs from GD in active and in remission and controls. B, The ratio of CD16/GAPDH was determined to give a mean net density. C, The ratio of CD32/GAPDH was determined to give a mean net density. D, The ratio of CD64/GAPDH was determined to give a mean net density. Data are presented as the means ± standard error. One‐way ANOVA was used to compare the differences in multiple groups. P < 0.05 was considered significant. GD, Graves' disease
