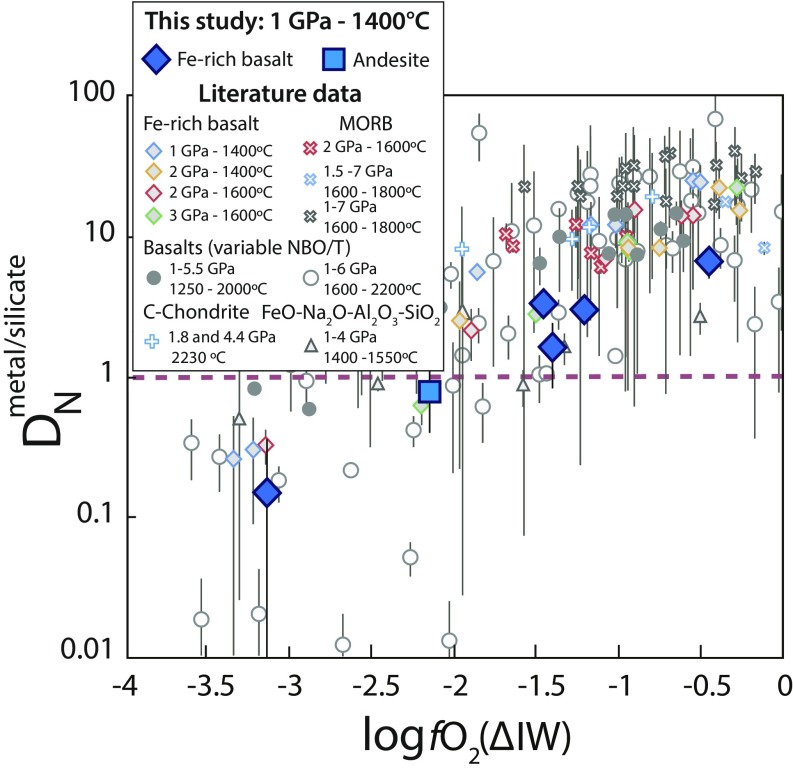
Fig. 1.
DNmetal-silicate as a function of fO2. Large symbols represent DNmetal-silicate values from this study, and small symbols are results from several previous studies: diamonds and red x’s (17), blue x’s (16), black x’s (21), gray circles (20), empty circles (22), triangles (18, 37, 50, 51), and blue crosses (15). All fO2 values were recalculated following the procedure described in the text. Following this calculation, only 2 of the 4 samples from Li et al. (16) have log fO2 < ΔIW. Error bars represent 2σ SDs. P–T conditions have only a small effect on DNmetal-silicate and explain the scatter among the overall decreasing trend with decreasing fO2. Our data measured using SIMS (Fe-rich basalt and andesite) are in agreement with previously published DNmetal-silicate values measured by EPMA.

