Fig. 3.
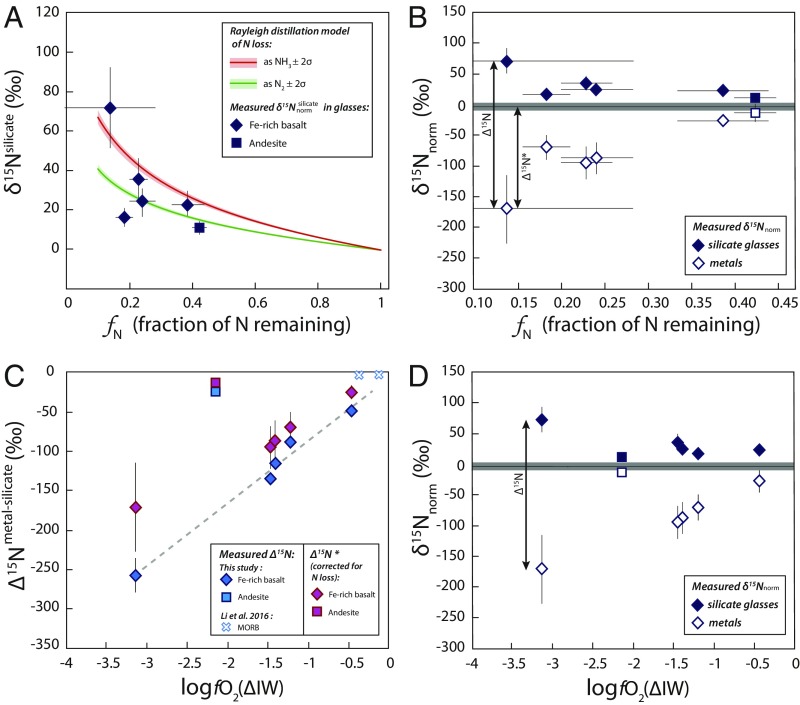
Effect of N loss (A and B) and fO2 (C and D) on N-isotopic fractionation ∆15Nmetal-silicate. (A) Modeled effect of N loss by Rayleigh distillation on the δ15Nnorm values of silicate glasses as a function of fN, the fraction of N remaining in the sample at the end of the experiments compared with the initial N content of the starting materials. The values represent measured 15N/14Nsilicate ratios normalized to the initial 15N/14N ratio of the starting material (see text and Table 1). Rayleigh distillation was modeled for N2 loss (green curve) and NH3 loss (red curve) as , where α is the fractionation factor approximated here by = 1.02 for N2 loss and by = 1.03 for NH3 loss. The positive δ15N values measured in our silicate glasses can be explained by the Rayleigh distillation model, suggesting that N loss may have increased the δ15N values of the silicate glasses. (B) Evolution of δ15N in the silicate glasses (closed symbols) and in the metal blobs (open symbols) as a function of fN. The δ15Nnorm values represent measured 15N/14Np ratios (p representing the metallic or silicate phase) normalized to the initial 15N/14N ratio of the starting material (see text and Table 1), and the gray line at 0‰ represents the initial δ15Nnorm value. The difference between the δ15N values measured in the metal and the silicate phases (δ15Nmetal − δ15Nsilicate) approximates the calculated ∆15Nmetal-silicate values. Considering that positive values may have been produced by N loss, the difference between the initial (0‰) and the values corresponds to ∆15N*, the N-isotopic fractionation corrected for N loss. (C) ∆15Nmetal-silicate as a function of fO2, showing both calculated ∆15Nmetal-silicate (blue symbols) and ∆15N* (purple symbols). The small blue x's are reproduced from Li et al. (16), with fO2 values recalculated following the procedure described in the text. Error bars represent 2σ SDs. Whereas the uncertainties on ∆15Nmetal-silicate are determined from the SDs on 15N/14N ratios measured by SIMS, the larger uncertainties on fN, δ15Nnorm values, and ∆15N* are derived from the weighing uncertainties associated with the addition of Si314N4 and Si315N4 to the starting materials. The dashed line represents a linear regression (r2 > 0.9) on the ∆15Nmetal-silicate values measured in Fe-rich basalt. ∆15Nmetal-silicate data describe 2 trends that can be explained by compositionally dependent differences in N speciation in the silicate glasses (see text). (D) Evolution of δ15Nnorm in the silicate glasses and metal blobs as a function of fO2. This plot shows that positive values can also be produced by N-isotopic fractionation during metal segregation from the melt via the formation of 14N–Fe bonds in the metal from 14N in NH complexes in the melt. This process becomes more important as the fO2 decreases due to the increasing stabilization of NH complexes in the melt under more reducing conditions.

