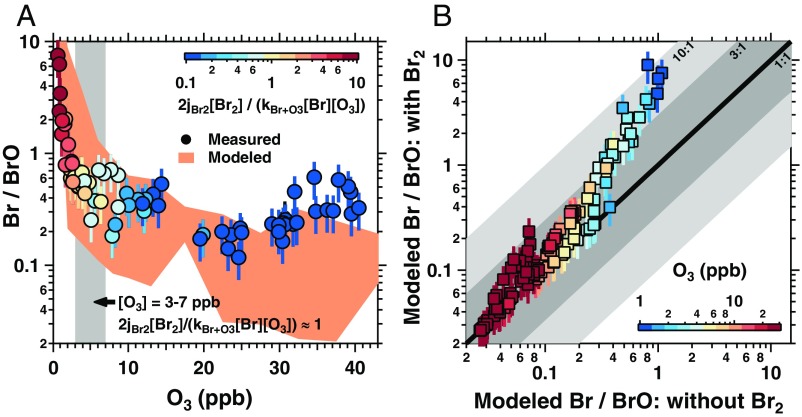
Fig. 3.
(A) Measured Br/BrO ratios (ppt ppt−1) as a function of measured O3. Data points are color-coded by 2jBr2[Br2]/kBr+O3[Br][O3], calculated from measured Br2, Br, and O3; the gray shading shows the O3 levels for which this calculated ratio is ∼1. Orange shading shows the range in modeled Br/BrO ratios (Methods). (B) Modeled Br/BrO ratios, with/without constraining Br2, color-coded by measured O3. Shaded areas correspond to differences of factors of 3 and 10. Error bars represent propagated Br2 measurement uncertainty; data below the limit of quantitation are excluded.

