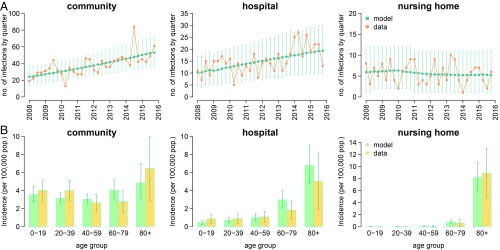
Fig. 1.
Model fit and validation. (A) Quarterly time series of the number of infections reported in the community, hospitals, and nursing homes from 2008 to 2015 with 95% CIs; green: model output (average and 95% CI); orange: data from the Norwegian national registry. (B) Age-specific yearly incidence of infections, averaged over the study period; light green: model (average and 95% CI); yellow: data from the Norwegian national registry.

