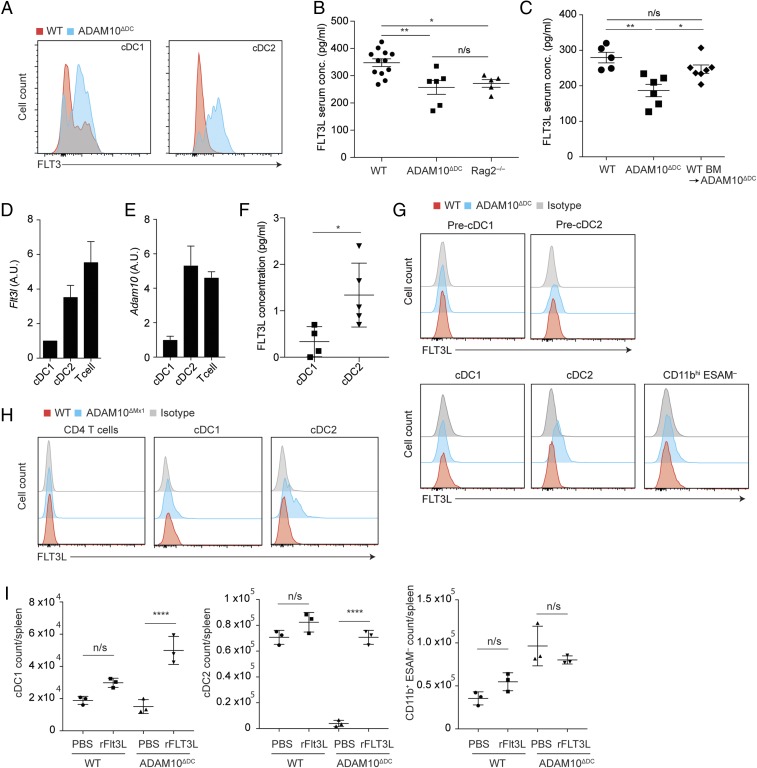
Fig. 4.
ADAM10 deficiency leads to increased membrane-bound FLT3L on cDC2 cell surface. (A) Flow cytometry analysis for cell-surface Flt3 expression on splenic cDC1s and cDC2s from WT littermate and ADAM10ΔDC mice. (B) ELISA analysis for serum FLT3L concentrations in WT, ADAM10ΔDC, and Rag2−/− mice. (C) ELISA analysis for serum FLT3L concentrations in WT, ADAM10ΔDC, and ADAM10ΔDC mice that were reconstituted with WT BM. (D) Quantitative real-time PCR analysis for Flt3l expression in cDC1s, cDC2s, and T cells that were sorted from WT mouse spleens displayed as arbitrary units (A.U.). (E) Quantitative real-time PCR analysis of RT-PCR for Adam10 expression in splenic cDC1s, cDC2s, and T cells from WT mice. (F) WT cDC1s and cDC2s were sorted from the spleen and cultured for 2 d. Supernatants were collected and analyzed via ELISA for FLT3L concentrations. (G) Flow cytometry analysis for cell-surface FLT3L on splenic pre-DC1s, pre-DC2s, cDC1s, and cDC2s from WT and ADAM10ΔDC mice or (H) WT and ADAM10ΔMx1 mice. (I) Absolute numbers of cDC1s, cDC2s, and CD11bhi ESAM− DCs in spleens from WT or ADAM10ΔDC mice that received i.p. administration of rFlt3L or PBS solution. B and C are pooled data from 2 and 3 independent experiments, respectively. D–F are representative of 2 experiments. G and H are representative of 3 independent experiments with n = 3 in each group. I is representative of 2 independent experiments. B, F, and I are shown as mean ± SD. Statistical significance was measured by ANOVA with Tukey’s multiple comparison test in B, C, and I and by Student’s t test in F (*P < 0.05, **P < 0.01, and ****P < 0.0001; n/s: not significant).

