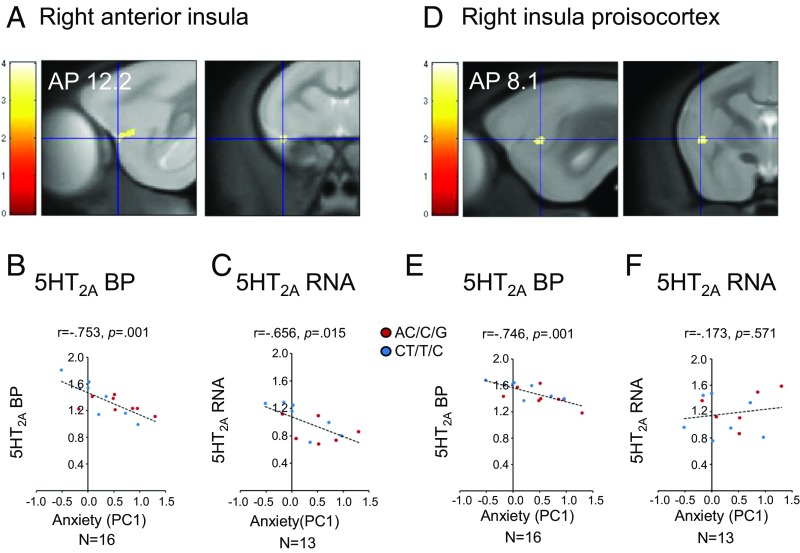
Fig. 3.
Relation of 5HT2A to trait anxiety scores. Voxel-based analysis correlating 5HT2A BP with anxiety scores (PC1) derived from the population PCA of the HI test. (A) Specific cluster in right anterior insula (anteroposterior coordinate [AP] = 12.2) in sagittal (Left) and coronal (Right) sections centered at the highest significant peak (t = 4.01). Correlations between right anterior insula 5HT2A BP (B; Pearson correlation: r = −0.753, P = 0.001) and 5HT2A RNA (C; Pearson correlation: r = −0.656, P = 0.015) with anxiety scores (PC1) are shown. (D) Specific cluster in right insula proisocortex (AP = 8.1) in sagittal (Left) and coronal (Right) sections centered at the highest significant peak (t = 3.73). Correlation between right insula proisocortex 5HT2A BP (E; Pearson correlation r = −0.746, P = 0.001) and 5HT2A RNA (F; Pearson correlation r = −0.173, P = 0.571) with anxiety scores (PC1) are shown. AP coordinates from ref. 70.

