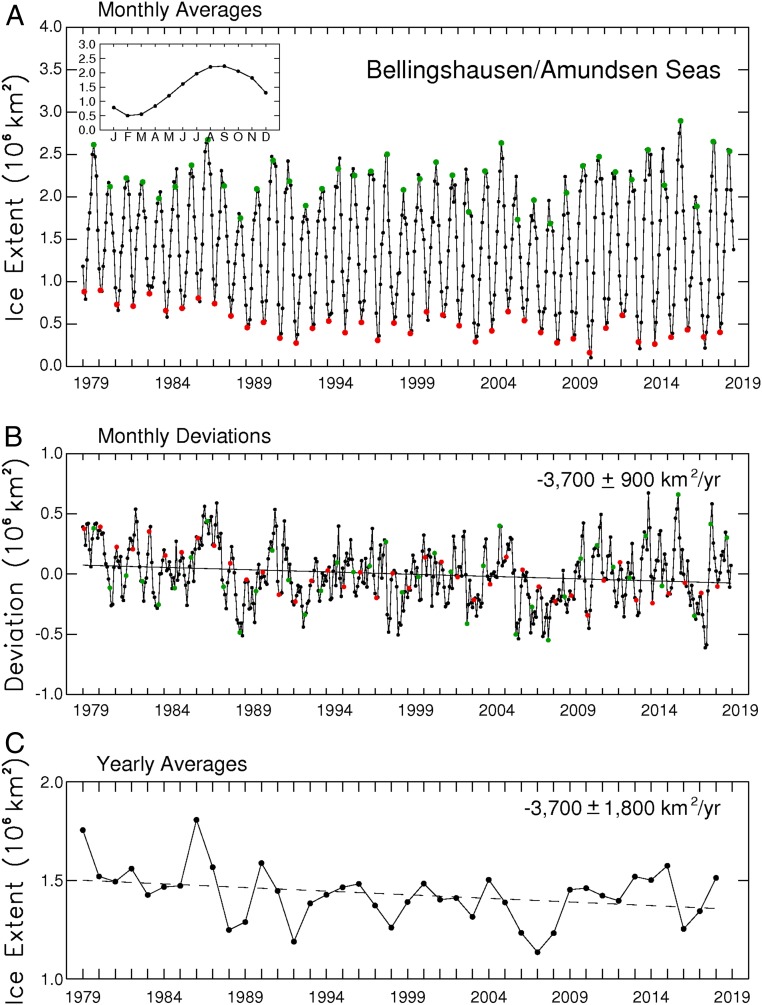
Fig. 7.
(A) Monthly average sea ice extents in the Bellingshausen/Amundsen Seas, 1979–2018. February extents are colored red, September extents green, and all others black. (Inset) The 40-y average annual cycle. (B) Monthly deviations, with the line of linear least squares fit and its slope and SD. (C) Yearly averages and their line of linear least squares fit.

