Fig. 6.
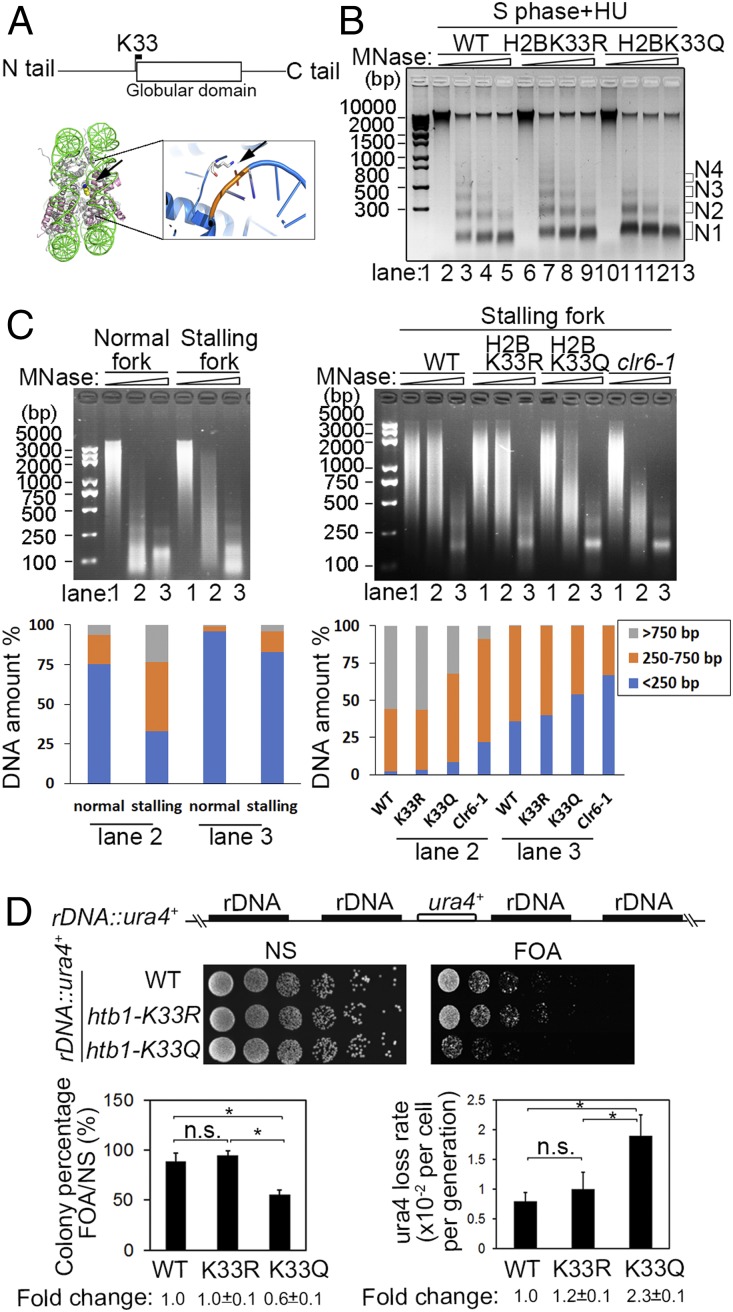
A relaxed chromatin and genomic instability at the native rDNA replication barrier site in the H2BK33Q mutant cells. (A and B) Chromatin compaction is compromised in H2BK33Q mutant cells. (A, Top) Location of K33 in the histone H2B sequence. (A, Bottom) H2BK33 indicated by arrow contacts with DNA within the nucleosome core particle (Xenopus laevis, PDB 1AOI), and this interaction is enlarged on the Right. (B) MNase digestion of chromatin from the WT, H2BK33R, and H2BK33Q cells under HU treatment. The cdc25-22 cells were first arrested at G2/M phase and then released into S phase in the presence of HU. N1-4 indicates the number of nucleosomes. (C) MNase digestion of local chromatin regions of normal or stalling replication forks. The cdc25-22 Polδ-cdc1-3Flag cells with various genetic background indicated below were first arrested at G2/M phase and then released into S phase in the absence or presence of HU. The experimental method is basically similar to Fig. 2 A, Right except that chromatin was sonicated to an average size of 2,000 to 5,000 bp. (Left) The WT cells arrested at G2/M phase were released into S phase in the absence or presence of HU. (Right) WT, H2BK33R, H2BK33Q, and clr6-1 cells were released into S phase in the presence of HU. (Bottom) The percentage of DNA amount for the indicated range of DNA size was measured for lanes 2 and 3 by Quantity One software. (D) A relaxed chromatin results in genomic instability in the rDNA genomic locus in htb1-K33Q cells. (Top) ura4 gene integrated into the spacer region in the rDNA genes in the WT, htb1-K33R, and htb1-K33Q strains. (Middle) Examination of expression level of ura4 gene at the rDNA locus in the WT and H2BK33 mutants by spot assay. (Bottom Left) The percentage of colonies grown in FOA plates. (Bottom Right) Loss rate of the ura4 gene in WT and H2BK33R/Q mutant cells. *P < 0.05; P > 0.05, not significant (n.s.).

