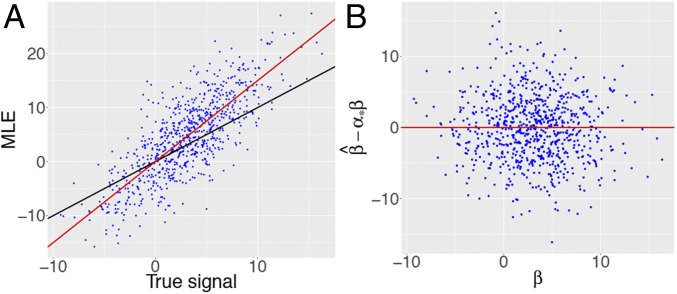
Fig. 9.
Simulation for a non-Gaussian design. The th feature takes values in with probabilities ; here, and for . Features are then centered and rescaled to have unit variance. The setting is otherwise the same as for Fig. 3. (A) Analogue of Fig. 3A. Red line has slope . (B) Analogue of Fig. 6B. Observe the same behavior as earlier: The theory predicts correctly the bias and the decorrelation between the bias-adjusted residuals and the true effect sizes.

