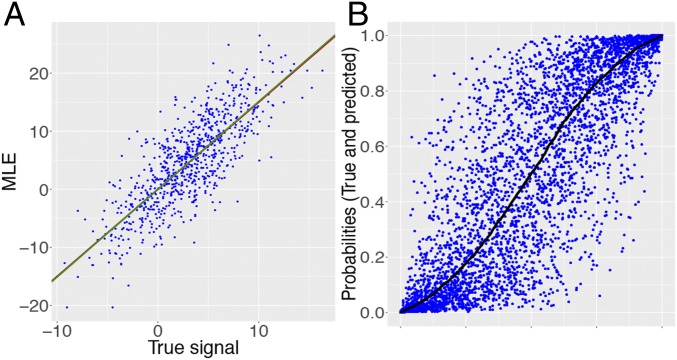
Fig. 14.
(A) Scatterplot of the pairs for the dataset from Fig. 3. Here, (red line) and our ProbeFrontier estimate is (green line). The estimate is so close that the green line masks the red. (B) True conditional probabilities (black curve) and corresponding estimated probabilities computed from the debiased MLE (blue points). Observe that the black curve now passes through the center of the blue point cloud. Our predictions are fairly unbiased.

