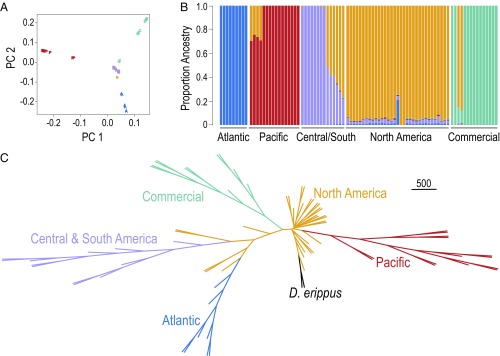
Fig. 2.
Commercial monarchs represent a distinct population of monarch butterflies derived from NA monarchs. (A) PCA of SNPs. Principle component 1 (PC1) accounts for 12.3% of the variation in the data, and PC2 accounts for 10.7%. (B) Analysis of SNP structure using Frappe. Each bar represents a single individual, and the colors represent the proportion of ancestry for five populations. (C) Neighbor-joining consensus tree based on SNP data. (Scale bar is equivalent to 500 bootstraps.)

