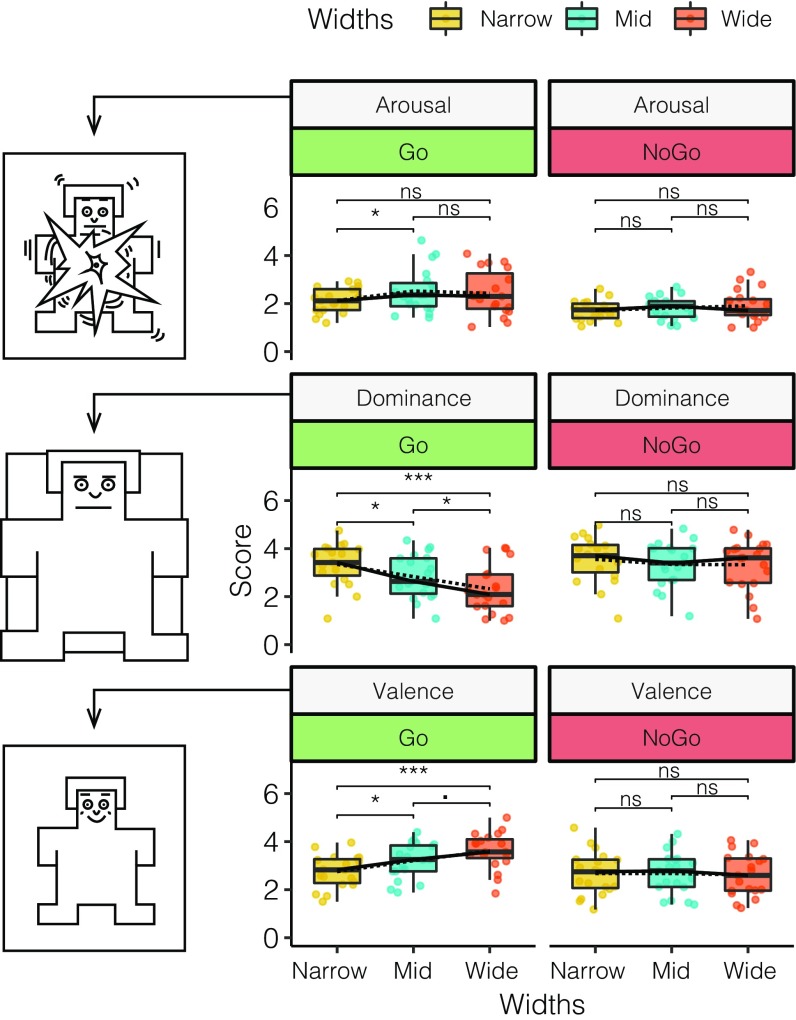
Fig. 3.
Boxplot of the SAM questionnaire results for the three different SAM scales (Arousal, Dominance, and Valence) as a function of the door width (Narrow, Mid, or Wide). (Left) Pictorial representation of the SAM manikin for the highest value of each condition presented. (Middle) SAM ratings for the Go condition. (Right) SAM ratings for the NoGo condition. Means are indicated by dashed lines; medians, by solid lines. P < 0.1, *P < 0.05, and ***P < 0.001; ns, not significant.

