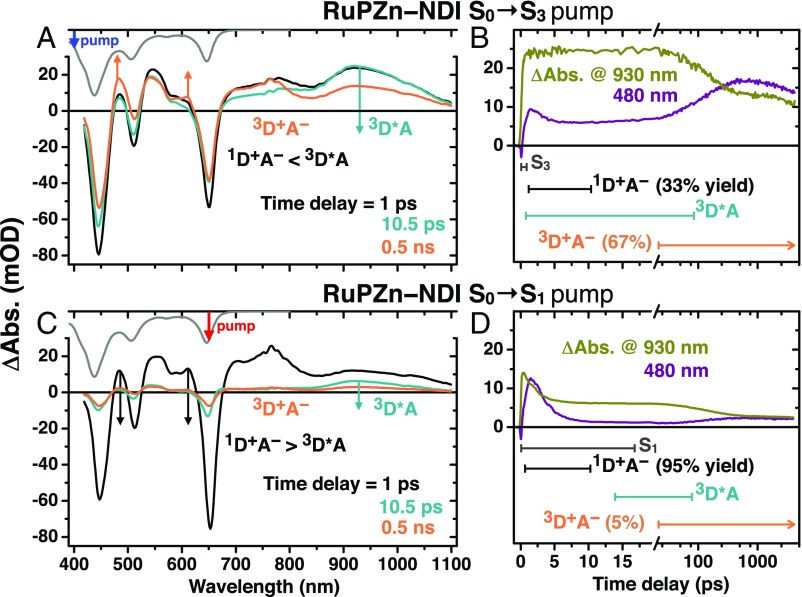
Fig. 3.
Excited-state evolution of RuPZn−NDI upon triggering one-way and U-turn ET events. (A and C) Pump–probe transient absorption difference (ΔAbs.) spectra of RuPZn−NDI in acetonitrile solvent following S0 → S3 and S0 → S1 excitation, respectively, at three time delays; color-coded labels denote the state that makes the dominant contribution to the transient spectrum. S0 → S3 excitation poises a one-way ET event, while S0 → S1 excitation poises a U-turn ET event. Arrows point in the direction of spectral evolution. The inverted, scaled electronic absorption spectrum of RuPZn−NDI is shown at the top of A and C. (B and D, Upper) Two kinetic traces of the pump–probe data in A and C. Gold traces primarily track the RuPZn-localized triplet state (3D*A); purple traces primarily track A− absorption of the singlet and triplet charge-separated states (1D+A− and 3D+A−, respectively). (B and D, Lower) Lengths of the horizontal bars denote the time windows where these states are populated. Time delay is a log scale after the axis break.

