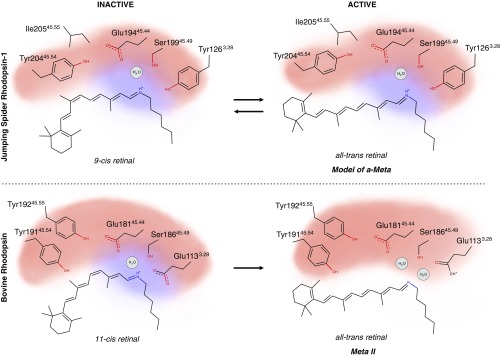
Fig. 8.
Comparison of activation models between different photosensitive GPCRs. The retinal binding pocket is represented schematically through its main components in JSR1 (Top) and bovine rhodopsin (Bottom). The red and blue clouds represent the distribution of the negative and positive charge, respectively. Upon illumination, the charge distribution changes due to the different physicochemical environment created by differing polar networks in the 2 receptors. The photoproduct of JSR1 is a schematic representation of a potential model.

