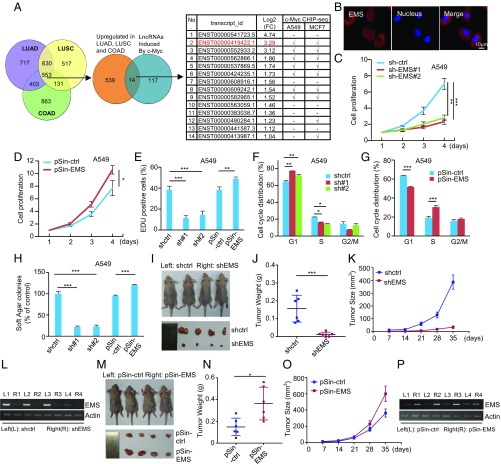
Fig. 1.
EMS functions as an oncogenic lncRNA. (A) Aberrantly expressed lncRNAs were analyzed in LUAD, LUSC, and COAD using TCGA database. A total of 553 lncRNAs overexpressed in these 3 cancer types (fold change [FC] ≥ 2, P < 0.05) were intersected with 131 c-Myc–induced lncRNAs in A549 cells (FC ≥ 2, P < 0.05) identified by RNA sequencing. Fourteen overlapping lncRNAs were then analyzed for potential association of c-Myc with their promoter regions using ENCODE c-Myc ChIP-seq datasets. (B) Localization of EMS in A549 cells was determined by RNA-fluorescence in situ hybridization analysis. (C) A549 cells were infected with lentiviruses expressing control shRNA (sh-ctrl), EMS shRNA#1, or EMS shRNA#2. Forty-eight hours later, the cell growth curves were measured by counting cell numbers at the indicated time points. Data shown are mean ± SD (n = 3). **P < 0.01; ***P < 0.001. The knockdown efficiency of EMS is shown in SI Appendix, Fig. S1D. (D) A549 cells were infected with lentiviruses expressing control (pSin-ctrl) or EMS (pSin-EMS). Forty-eight hours later, the cell growth curves were measured. Data shown are mean ± SD (n = 3). *P < 0.05. The successful overexpression of EMS is shown in SI Appendix, Fig. S1E. (E) A549 cells were infected with lentiviruses expressing control shRNA (shctrl), EMS shRNA#1, EMS shRNA#2, control (pSin-ctrl), or EMS (pSin-EMS). Forty-eight hours later, cells were subjected to EdU incorporation assay. Data shown are mean ± SD (n = 3). **P < 0.01; ***P < 0.001. (F) A549 cells were infected with lentiviruses expressing control shRNA, EMS shRNA#1, or EMS shRNA#2. Seventy-two hours later, cells were subjected to flow cytometry analysis. Data shown are mean ± SD (n = 3). *P < 0.05; **P < 0.01. (G) A549 cells were infected with lentiviruses expressing either control (pSin-ctrl) or EMS (pSin-EMS). Seventy-two hours later, cells were subjected to flow cytometry analysis. Data shown are mean ± SD (n = 3). ***P < 0.001. (H) A549 cells were infected with lentiviruses expressing control shRNA, EMS shRNA#1, EMS shRNA#2, control (pSin-ctrl), or EMS (pSin-EMS). Forty-eight hours later, cells were assayed for their ability to form colonies in soft agar. Data shown are mean ± SD (n = 3). ***P < 0.001. (I–L) Total of 2 × 10⁶ A549 cells transduced with lentiviruses expressing either control shRNA or EMS shRNA (shEMS) were individually injected into the left flank and right flank of nude mice as indicated (n = 6 for each group). (I) Representative photographs of mice and xenograft tumors were taken 5 wk after injection. (J) Excised tumors were weighed. ***P < 0.001. (K) Tumor sizes were measured at the indicated time points. (L) RNA extracts from the excised xenografts were also analyzed by RT-PCR. (M–P) Total of 2 × 10⁶ A549 cells transduced with lentiviruses expressing either control (pSin-ctrl) or EMS (pSin-EMS) were individually injected into the left flank and right flank of nude mice as indicated (n = 6 for each group). (M) Representative photographs of mice and xenograft tumors were taken 5 wk after injection. (N) Excised tumors were weighed. *P < 0.05. (O) Tumor sizes were measured at the indicated time points. (P) RNA extracts from the excised xenografts were also analyzed by RT-PCR.

