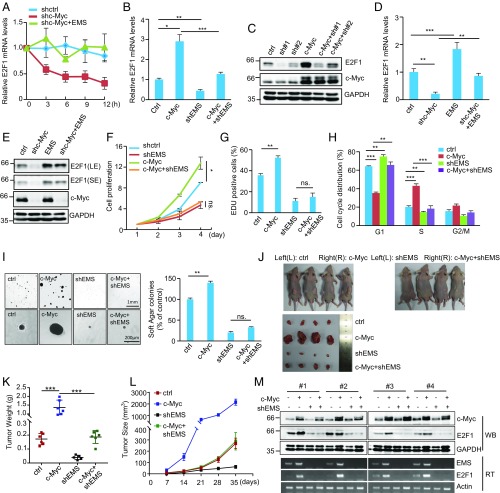
Fig. 5.
EMS connects c-Myc to cell cycle control and tumorigenesis. (A) A549 cells were infected with lentiviruses expressing control shRNA (shctrl), c-Myc shRNA (shc-Myc), or both c-Myc shRNA and EMS. Forty-eight hours later, cells were incubated with actinomycin D (2 μg/mL) for the indicated periods of time. Total RNA was then analyzed by real-time RT-PCR. Data shown are mean ± SD (n = 3). (B) A549 cells were infected with lentiviruses expressing control (Ctrl), c-Myc, EMS shRNA (shEMS), or both c-Myc and EMS shRNA. Forty-eight hours later, total RNA was analyzed by real-time RT-PCR. Data shown are mean ± SD (n = 3). *P < 0.05; **P < 0.01; ***P < 0.001. (C) A549 cells were infected with lentiviruses expressing control, EMS shRNA#1, EMS shRNA#2, c-Myc, both c-Myc and EMS shRNA#1, or both c-Myc and EMS shRNA#2. Forty-eight hours later, cell lysates were analyzed by Western blotting. (D) A549 cells were infected with lentiviruses expressing control, c-Myc shRNA, EMS, or both c-Myc shRNA and EMS. Forty-eight hours later, total RNA was analyzed by real-time RT-PCR. Data shown are mean ± SD (n = 3). **P < 0.01; ***P < 0.001. (E) A549 cells were infected with lentiviruses expressing control, c-Myc shRNA, EMS, or both c-Myc shRNA and EMS. Forty-eight hours later, cell lysates were analyzed by Western blotting. (F) A549 cells were infected with lentiviruses expressing control, c-Myc, EMS shRNA, or both c-Myc and EMS shRNA. Forty-eight hours later, the cell growth curves were measured. Data shown are mean ± SD (n = 3). *P < 0.05. ns., no significance. (G) A549 cells were infected with lentiviruses expressing control, c-Myc, EMS shRNA, or both c-Myc and EMS shRNA. Forty-eight hours later, cells were subjected to EdU incorporation assay. Data shown are mean ± SD (n = 3). **P < 0.01. (H) A549 cells were infected with lentiviruses expressing control, c-Myc, EMS shRNA, or both c-Myc and EMS shRNA. Seventy-two hours later, cells were subjected to flow cytometry analysis. Data shown are mean ± SD (n = 3). **P < 0.01; ***P < 0.001. (I) A549 cells were infected with lentiviruses expressing control, c-Myc, EMS shRNA, or both c-Myc and EMS shRNA. Forty-eight hours later, cells were assayed for their ability to form colonies in soft agar. The shown images are representative of 3 independent experiments. Data shown are mean ± SD (n = 3). **P < 0.01. (J–M) Total of 2 × 10⁶ A549 cells transduced with lentiviruses expressing control, c-Myc, EMS shRNA, or both c-Myc and EMS shRNA were individually injected into the left flank and right flank of nude mice as indicated (n = 6 for each group). (J) Representative photographs of mice and xenograft tumors were taken 5 wk after injection. (K) Excised tumors were weighed. ***P < 0.001. (L) Tumor sizes were measured at the indicated time points. (M) RNA and protein extracts from the excised xenografts were also analyzed by RT-PCR (RT) and Western blotting (WB), respectively.

