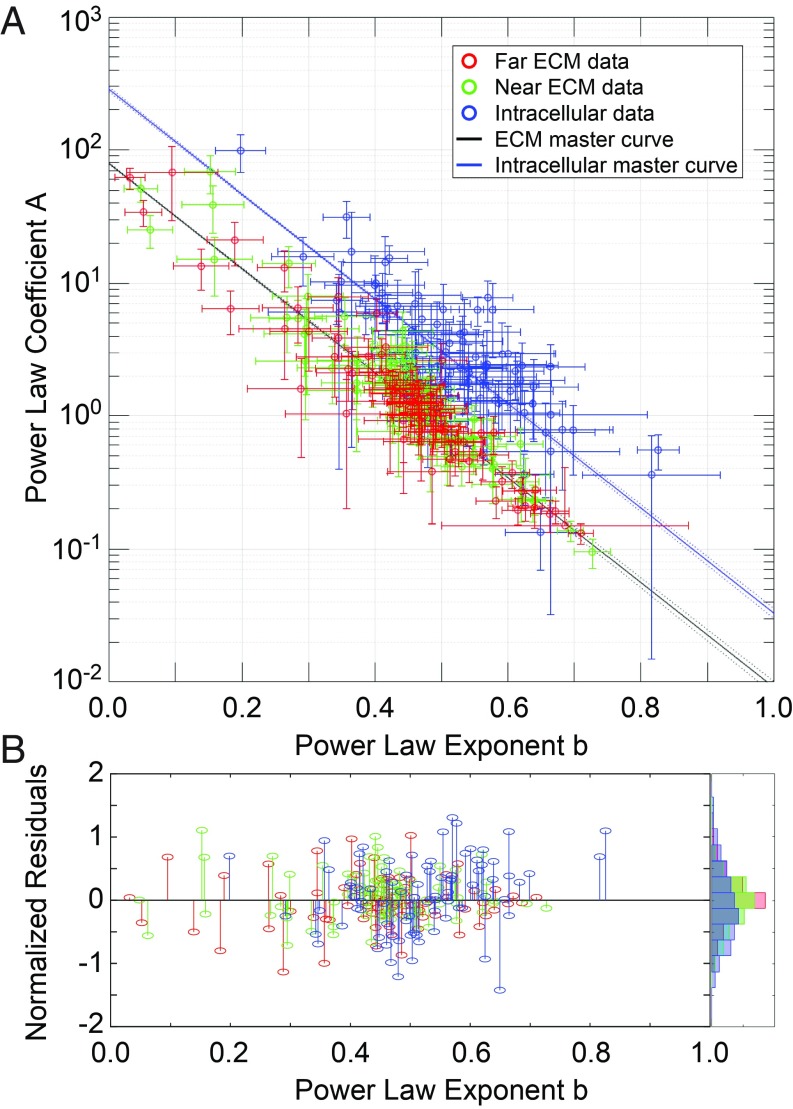
Fig. 5.
Power law fit parameters fall on master curves. Five cell lines (MCF10A, MCF10-CA1, MCF7, D2.A1, and D2.0R) were measured in 2 ECMs (3D lrECM and 3D HA), at 2 time points (0 to 4 h and 24 to 28 h after embedding), under 4 drug treatment conditions (untreated, +10 µM blebbistatin, +10 µM Y27632, +10 nM calyculin A). For each experiment, at least 3 individually prepared samples were measured. For each sample, at least 3 cells were measured. For each cell, at least 3 intracellular beads, 3 beads in near-ECM (within 10 µm from the cell) and 3 beads in far-ECM (at least 50 µm from the nearest cell) were measured. For each bead, 7 technical replicates were measured at 20 frequencies each. |G*| values were calculated from each replicate, and all replicates were pooled for each condition to calculate mean |G*| values at each frequency. For each condition, the mean G* values at high frequencies (>400 Hz) were fit to a power law |G*(ω)| = Aωb. (A) Plot of all of the fit parameters from each condition, with all intracellular data plotted in blue, all near-ECM data plotted in green, and all far-ECM data plotted in red. Error bars represent the 95% confidence intervals of the fit. All intracellular data were then fit to a master relation Ai = exp((α − bi)/β), where the Ai and the bi are the power law coefficient (A) and exponent (B) of the ith experimental condition (such as, e.g., near-ECM of D2.A1 cells in 3D HA at 24 to 28 h treated with 10 µM Y27632), and α and β are global parameters of the master relation. The data were split into 2 groups to fit the master relations. The intracellular data were fit separately, giving αintra and βintra (solid blue line). Separate fits of near- and far-ECM data showed very similar values for α and β, so they were combined and fit together to give αextra and βextra (solid black line). Dashed lines show prediction bounds at 95% confidence. (B) Normalized residuals (1 − bfit/b) of each data point to its respective fit line, with a normalized histogram plotted at the right.

