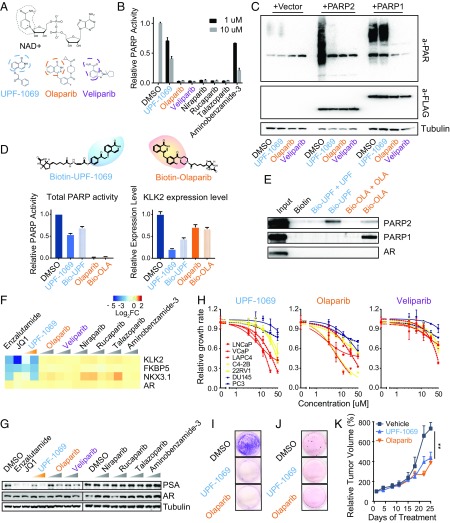
Fig. 4.
Selective PARP-2 inhibitor UPF-1069 suppresses AR target gene expression and AR-positive PCa cell growth. (A) Chemical structures of NAD+, UPF-1069, olaparib, and veliparib. Similar moieties shared by the compounds are circled. (B) LNCaP cells were treated with PARPi as indicated. Total PARP activity in cell lysates after the treatment was determined by PARP Universal Colorimetric Assay. (C) LNCaP cells were transfected with vector, FLAG-tagged PARP-1, or PARP-2 for 48 h before being treated with PARPi (10 µM) as indicated for another 4 h. The expression level of total PARylated proteins in cell lysates was determined by Western blot using antibody against poly(ADP-ribose) (PAR). Anti-FLAG was used to determine the expression levels of PARP-1 and PARP-2. The tubulin level serves as a protein loading control. (D) Synthesis of biotinylated UPF-1069 and olaparib. (Upper) The chemical structures of biotinylated small molecules with UPF-1069 and olaparib highlighted in blue and orange, respectively. The efficacy of biotinylated UPF-1069 (Bio-UPF) and olaparib (Bio-OLA), in comparison with unmodified PARPi, was determined by their inhibitory effects on total PARP activity (Lower Left) and KLK2 expression levels (Lower Right) after treatment for 24 h. (E) Western blot analyses of protein eluates from biotinylated UPF-1069 or olaparib coated beads after incubation with LNCaP cell lysate in the presence or absence of unmodified UPF-1069 and olaparib. (F) A heat map shows expression alteration of AR and AR target genes in LNCaP cells after treatment with Enzalutamide (10 µM), JQ1 (0.5 µM), or PARPi (1 and 10 µM) for 24 h. (G) Protein expression levels of PSA, AR, and tubulin in LNCaP cells after treatment with small molecule inhibitors as indicated for 24 h. (H) Inhibition of PCa cell proliferation by UPF-1069, olaparib, and veliparib. Red curves, androgen-dependent PCa cell lines; yellow, AR-positive CRPC cell lines; blue, AR-negative CRPC lines. (I and J) Clone-forming ability of LNCaP cells after treatment with UPF-1069 (10 µM), olaparib (10 µM), or DMSO was determined by clonogenic assays (I) and soft agar assays (J). (K) Relative tumor volume of VCaP xenografts in mice treated with vehicle, UPF-1069 or Olaparib for 3.5 wk (7 mice per group). All experiments except for animal experiment were repeated at least three times. All data represent the mean ± SD. Statistical significance was determined by one-way ANOVA followed by Tukey’s multiple comparisons to the control group. **P < 0.01.

