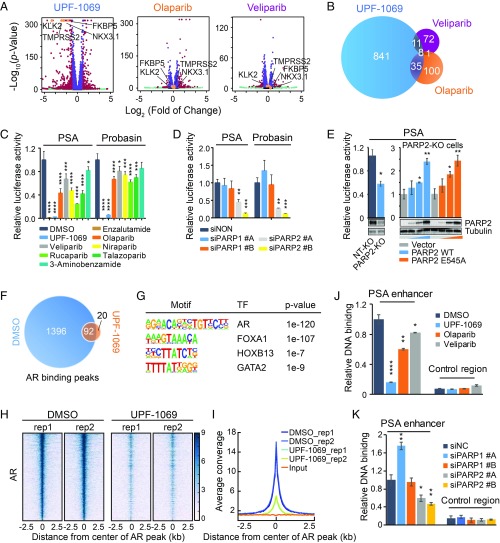
Fig. 5.
Inhibition of PARP-2 abrogates genome-wide AR recruitment. (A) Gene expression profiling of LNCaP cells after treatment with UPF-1069 (10 µM), olaparib (10 µM), or veliparib (10 µM) for 24 h. Differentially expressed genes with fold change >2 and FDR <0.01 are labeled in red. Four classic AR target genes are highlighted in orange. (B) Overlap between UPF-1069–, olaparib-, and veliparib-altered genes. (C) PSA and Probasin luciferase reporter plasmids containing highly conserved androgen response elements were transfected into LNCaP cells. The treatment with PARPi (10 µM) as indicated started 4 h after transfection. Luciferase activity was measured 24 h after reporter transfection. (D) PARP-1 and PARP-2 siRNA KD was conducted in LNCaP cells through reverse transfection 48 h before luciferase reporter plasmid transfection. Luciferase activity was measured 24 h after reporter transfection. (E) A PARP-2 KO cell line and a nontargeting (NT) control line were generated through ribonucleoprotein (RNP) delivery approach as described in Materials and Methods. KO efficiency was confirmed by Western blot. PSA luciferase report activity was decreased in PARP-2 KO cells but rescued after overexpression of PARP-2 wild-type (WT) or E545A mutant plasmid in a dose-dependent manner (0, 50, 100, 200 ng per well). PARP-2 overexpression was examined by Western blot. (F) Venn diagram illustrating the overlap of AR binding sites identified by AR ChIP-seq in LNCaP cells between DMSO and UPF-1069 (10 µM) treatments for 16 h. (G) Motifs enriched in AR binding sites. (H) A heat map showing AR ChIP-seq signal density in a region of 2.5 kb flanking AR binding summits. Two replicates (rep) for each treatment are presented. (I) A summary plot of AR average signal density (reads per genomic coverage) across all AR-binding sites. (J and K) Relative AR binding determined by ChIP-qPCR at the PSA enhancer and the control region in LNCaP cells after treatment with PARPi for 16 h (J) or 2 d after siRNA KD (K). All data represent the mean ± SD of three technical replicates. All experiments except for RNA-seq and ChIP-seq were repeated at least three times. Statistical significance was determined by one-way ANOVA followed by Tukey’s multiple comparisons to the control group. *P < 0.05; **P < 0.01; ***P < 0.001; ****P < 0.0001.

