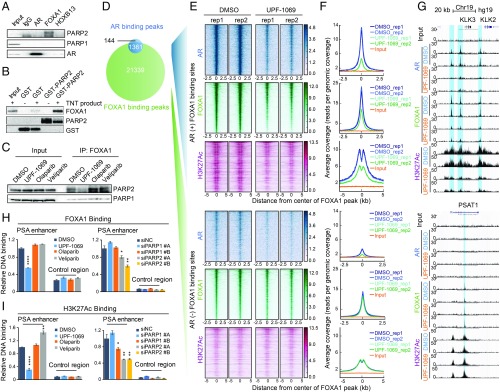
Fig. 6.
PARP-2 modulates FOXA1 function. (A) Co-IP showing association of endogenous PARP-1/PARP-2 with AR/FOXA1/HOXB13 in LNCaP cells. (B) GST pull-down showing direct interaction between purified GST-PARP-2 protein and FLAG-FOXA1 in vitro translation product (TNT product). (C) Co-IP showing Interaction between PARP-1/PARP-2 and FOXA1 in LNCaP cells after treatment with PARPi (10 µM) for 6 h. (D) Venn diagram showing the overlap of AR and FOXA1 binding sites identified by ChIP-seq in LNCaP cells. (E and F) Inhibition of PARP-2 disrupts FOXA1 binding and function at AR binding sites. Heat maps (E) and average signal density plots (F) showing AR, FOXA1, and H3K27Ac binding at the AR-occupied (+) (Upper) and non-AR-occupied (−) (Lower) FOXA1 binding sites (2.5 kb flanking FOXA1 binding summits) after treatment with DMSO or UPF-1069 (10 µM) for 16 h. (G) AR, FOXA1, and H3K27Ac ChIP-seq signals at KLK2, KLK3, and PSAT1 loci. (H and I) ChIP-qPCR results showing FOXA1 (H) and H3K27Ac (I) binding at the PSA enhancer and the control region in LNCaP cells after treatment with PARPi as indicated or PARP-1/PARP-2 siRNA KD. All experiments except for ChIP-seq were repeated at least three times. The ChIP-qPCR data represent the mean ± SD of three technical replicates. Statistical significance was determined by one-way ANOVA followed by Tukey’s multiple comparisons to the control group. *P < 0.05; **P < 0.01; ****P < 0.0001.

