Figure 2.
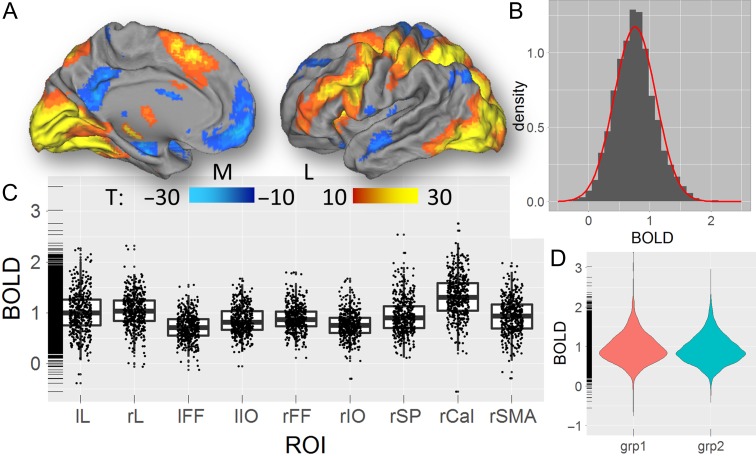
fMRI activation. (A) Statistical significance of the average BOLD signal changes induced by the “relation” and “match” epochs of the Relational task across 426 subjects of the HCP, superimposed on medial (M) and lateral (L) views of the left cortical hemisphere of the population-average Landmark- and Surface-based (PALS-B12) atlas of the cerebral cortex (Van Essen 2005). (B) Probability distribution of task-related %BOLD signal changes across subjects, averaged across ROIs (gray histogram) and the corresponding normal distribution (red curve). (C) Boxplot showing the average %BOLD signal change for each subject within each ROI. (D) Violin plot showing the reproducibility of the average %BOLD signal changes in groups 1 (N = 213) and 2 (N = 213). The rug plot visualization (C and D) supplement the 2d displays with 1d marginal distributions. lL and rL: left and right lingual gyri; lIO and rIO: left and right inferior occipital gyri; lFF and rFF: left and right fusiform gyri; rSP: right superior parietal cortex; rSMA: right supplementary motor area; and rCal: right pericalcarine cortex.

