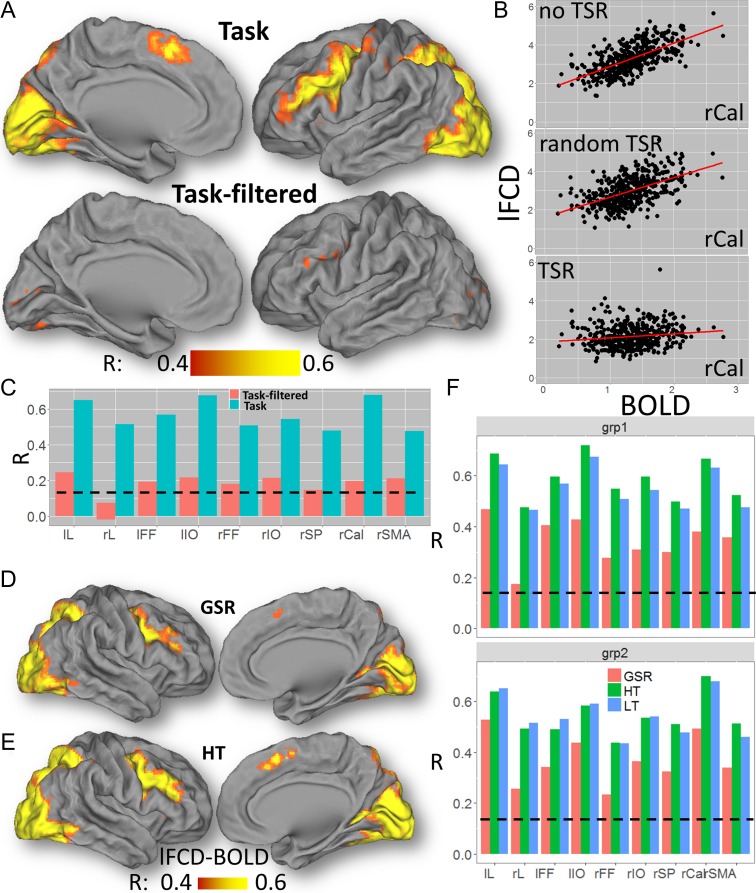
Figure 5.
BOLD-lFCD correlation. (A) Voxelwise correlation across 426 subjects between lFCD and the BOLD signal during the Relational task, superimposed on medial and lateral views of the left cortical hemisphere of the PALS-B12 atlas of the cerebral cortex. (B) Scatter plots showing a stronger linear association between lFCD and BOLD signals (% change) in the right pericalcarine cortex (rCal) for task (without TSR, R = 0.64; random TSR, R = 0.56) than for “task-filtered” (with TSR; R = 0.20) conditions. (C) Similar results were obtained for all ROIs. Voxelwise correlation maps across 426 subjects between the BOLD signal and lFCD computed with global signal regression (D) and with the high correlation threshold (E) for the Relational Task. (F) Bar plot showing that for all ROIs the correlation between lFCD and BOLD signals were similar for low (LT) and high (HT) correlation thresholds, and lower for lFCD computed with GSR compared to those without GSR. Black dashed line: P < 0.05, corrected for 9 ROIs (Bonferroni), 2-tailed. lL and rL: left and right lingual gyri; lIO and rIO: left and right inferior occipital gyri; lFF and rFF: left and right fusiform gyri; rSP: right superior parietal cortex; and rSMA: right supplementary motor area. Similar results were obtained for the Social task (not shown).

