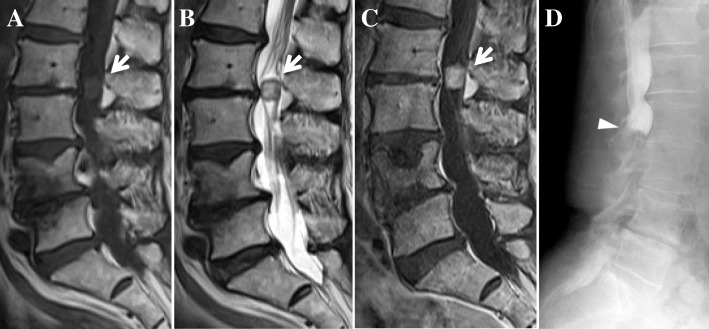
Fig. 1.
a–c Sagittal magnetic resonance imaging. a T1-weighted image. b T2-weighted image. c T1-weighted gadolinium-enhanced image. Intradural extramedullary mass at the level of L2–L3 showing T1-low, T2-high signals enhanced uniformly with gadolinium (arrow). d Lateral myelography showing a total block of contrast below the level of L2–L3 and capping of contrast by the mass (arrowhead)

