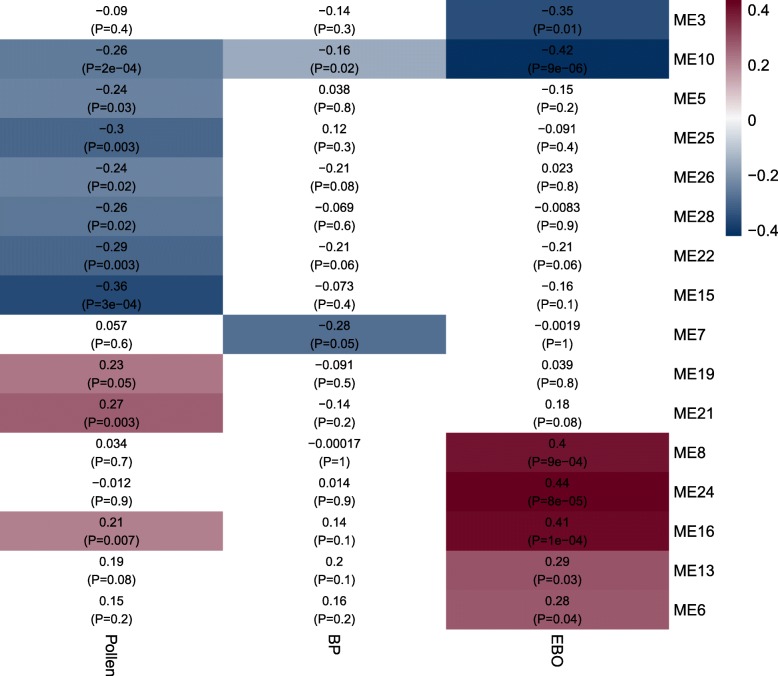
Fig. 4.
Weighted gene co-expression network analysis. Rows represent gene modules. Columns represent sample traits. Each cell contains two values: a correlation coefficient between the module and sample trait and the associated p-value in parentheses. Significant correlations are colorized according correlation coefficient, varying from high values in yellow to low values in purple

