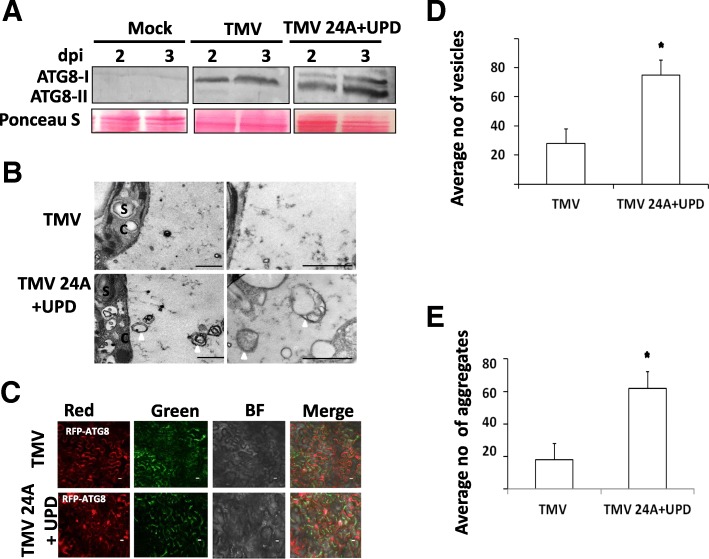
Fig. 1.
Autophagy activation in response to TMV and TMV24A + UPD infection in N. benthamiana. a Immunoblot analysis using ATG8 antibody. Molecular weight of the bands detected at ~ 16 kDa. The Ponceau S staining served as a loading control (lower panel, Ponceau S). b Representative electron micrographs showing infected plants at 3 dpi (days post inoculation). Arrows show membranous autophagosome-like structures. Abbreviations; S, starch, C, cytoplasm. c Representative images of RFP-ATG8 labelled autophagosomes at 3 dpi. d The number of autophagosome-like structures was obtained from ~ 100μm2 section for each experiment. Autophagosome-like structures were significantly enhanced by infection with TMV 24A + UPD (*p < 0.05). e The mean number of fluorescent puncta/aggregates were obtained from sections with approximately equal number of cells (~ 100) for each experiment. RFP-ATG8a autophagosomes were significantly enhanced by infection with TMV24A + UPD (*p < 0.05). The asterisks indicate significant differences by unpaired sample t test. The scale bar represents 1 μm

