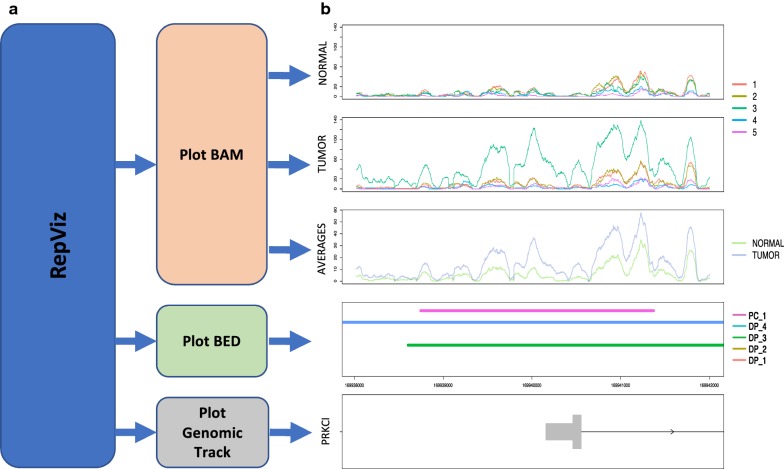
Fig. 1.
Overview and biological case examples of RepViz using histone modification data. a Overview of the main functions implemented in the software. b Example of a promoter region marked by H3K27Ac (GSE85467), where the mean signal in the second biological condition is driven by a single outlier replicate, but still leads to a significant differential peak call by multiple differential peak callers. Five replicates in two biological conditions are displayed in the first two panels and their mean signals in the third panel. The fourth panel is a visualization of the called peaks, where the uppermost row is from a peak caller MACS2 (PC) and the other rows are from differential peak callers (DP) (Additional file 1: Table S2). The lowest panel is the genomic track

