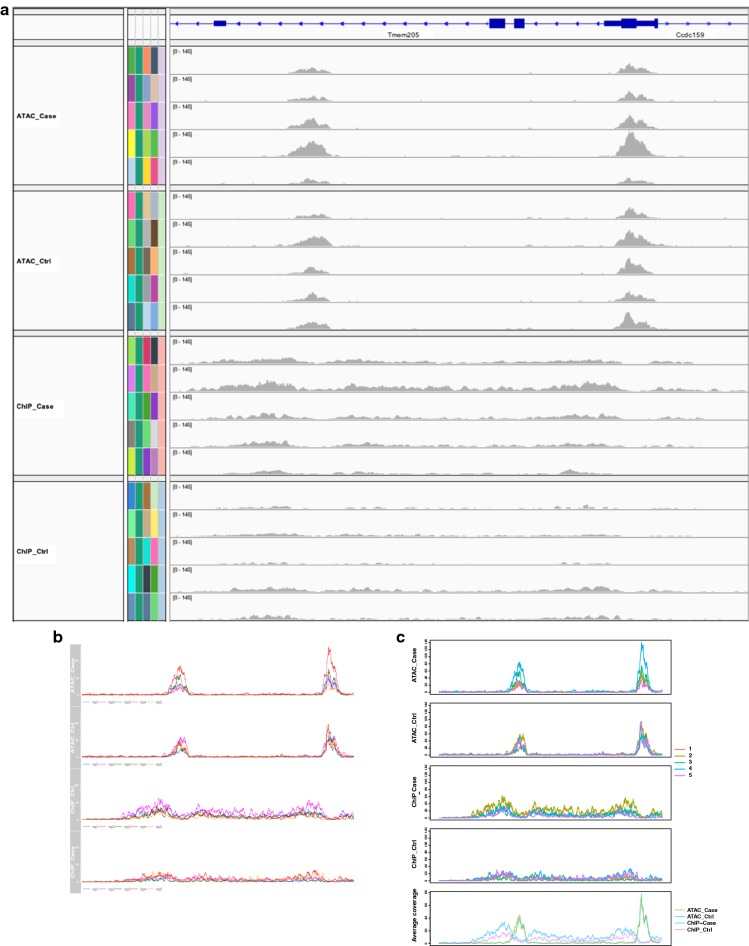
Fig. 2.
Comparison of (a) IGV, (b) Gviz, and (c) RepViz. IGV does not allow grouping of replicates to be presented in one track. With Gviz showing replicates in one track is possible, but it is not possible to compare a different number of grouped replicates to each other or include the average coverage under the grouped tracks like in RepViz. Data from GSE108990. Panels from the top to bottom are ATAC-seq case, ATAC-seq control, ChIP-seq case, and ChIP-seq control. In (c) the lower panel is representing the group-wise average signals for each of the conditions

