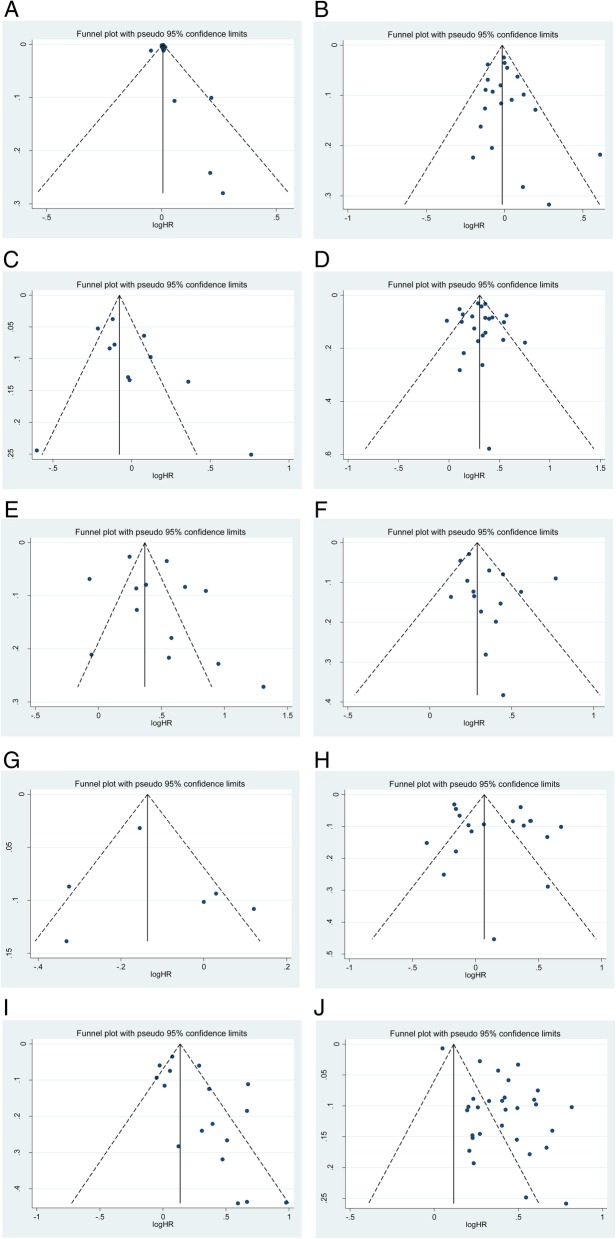
Fig. 4.
Funnel plots for the publication bias test. Each point represents a separate study for the indicated association. The vertical line represents the mean effects size: (4A) advanced age; (4B) gender; (4C) CIS; (4D) LVI; (4E) pathological stage; (4F) STSM; (4G) histology; (4H) ATC; (4I) tumor grade and (4 J) LNM

