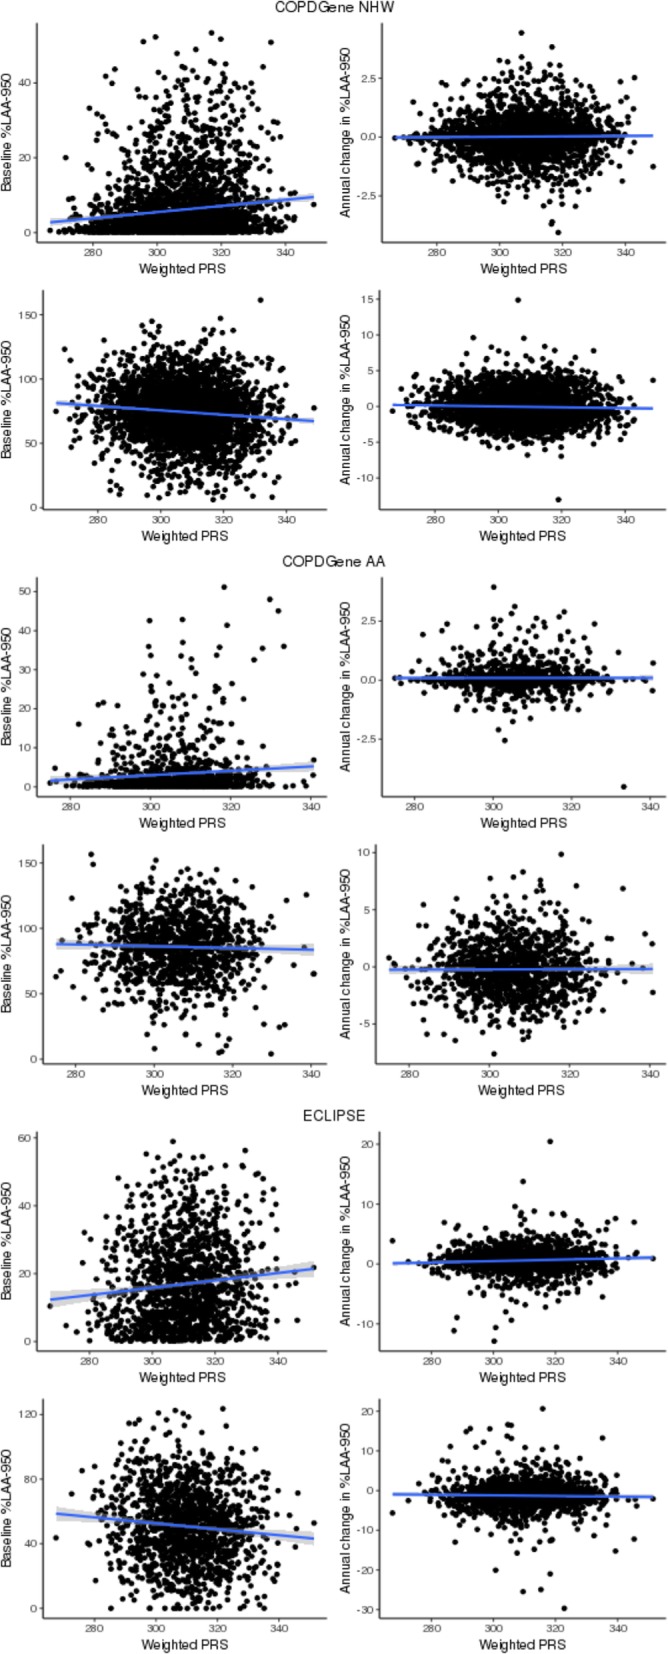
Fig. 1.

Scatter plot between lung function polygenic risk score and emphysema measures. %LAA-950=percentage of low-attenuation area less than -950 Hounsfield units; ALD=Adjusted lung density; NHW=Non-Hispanic Whites; AA=African Americans; ECLIPSE= Evaluation of COPD Longitudinally to Identify Predictive Surrogate End-points; PRS=Polygenic Risk Score
