
Fig. 2.
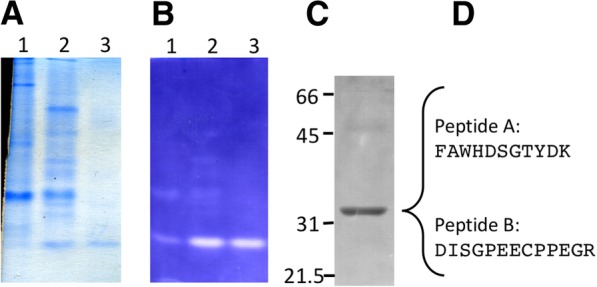
PAGE analysis of APX activity and protein during the purification of APX activity. Peak APX fractions were separated by nondenaturing 10% PAGE. a Gel stained with Coomassie blue. b APX activity was visualized by a nitroblue tetrazolium stain. Lanes 1: Peak APX fraction from DEAE sephacel (30 μg protein). Lanes 2: Peak APX fraction from phenyl Sepharose, Lanes 3: The fraction following the APX peak activity from phenyl Sepharose. c SDS-PAGE analysis of peak APX fraction. d Sequences of tryptic peptides identified by Edman degradation from the 32 kDa band in (c)