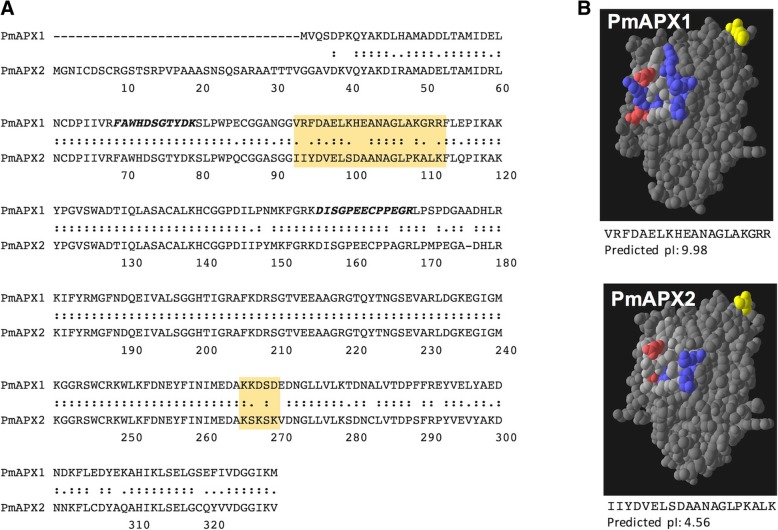
Fig. 3.
Comparison of the two predicted P. marinus APX proteins. a Alignment of PmAPX1 and PmAPX2 amino acid sequences. Amino acid numbering refers to PmAPX2. The shaded areas highlight regions that differ most between the two proteins. Peptides identified by MALDI are in bold italics, the peptide at position 156–168 corresponds to Peptide B in Fig. 2d. b 3-dimensional models of PmAPX1 and PmAPX2 based on the crystal structure of soybean APX. Residues are color coded to highlight the region identified in part A. Acidic residues are red while basic residues are blue. The N-terminal methionine of each protein is shown in yellow

