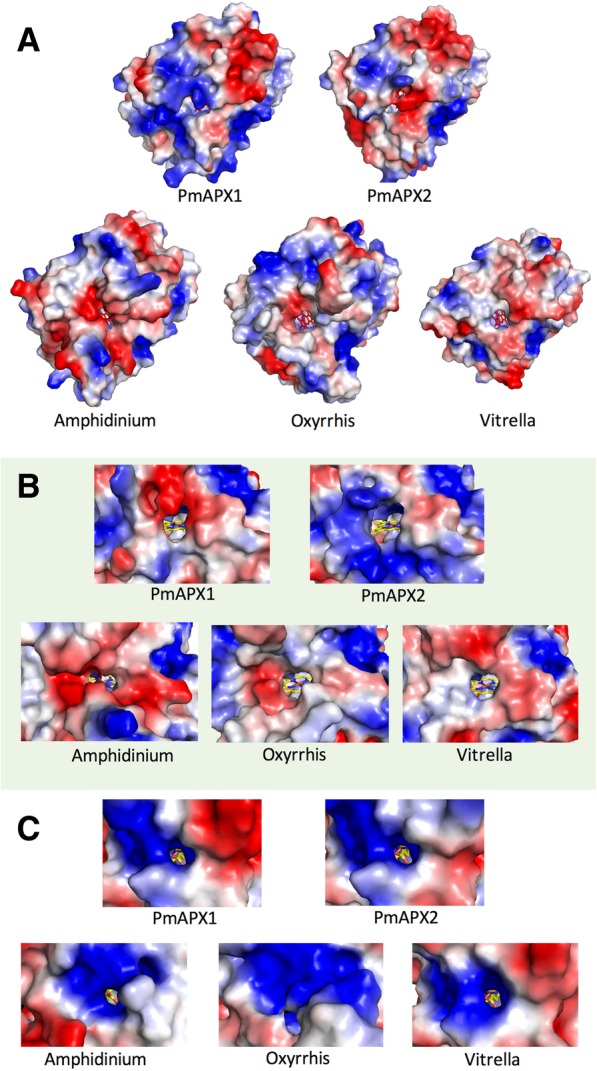
Fig. 8.

Surface charge comparisons of PmAPX1 and PmAPX2. a Electrostatic potential surface based on the surface charges of the face presented in Fig. 7a. Negatively charged (acidic) surfaces in red, positive (basic) charges in blue and neutral charged surfaces in white. b Surface charge representation at the aperture leading to the delta heme edge. c Surface charge representation at the aperture leading to the gamma heme edge
