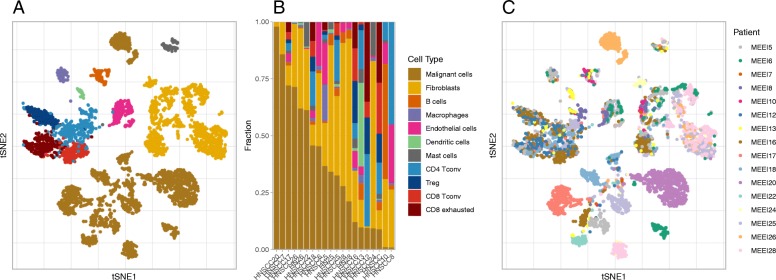
Fig. 1.
Profiling cellular composition of HNSCC tumors using scRNA-seq. a 2D t-sne projection of the expression profiles of 5,712 single cells (3,259 immune cells and 2,453 malignant cells) from 20 HNSCC tumors and lymph node samples of 16 patients. Single cells are shown in dot and colored by cell types. b Cell composition per sample. Patients are ordered by their fractions of malignant cells. c The same 2D t-sne projection as (a) with cells colored by patient origins

