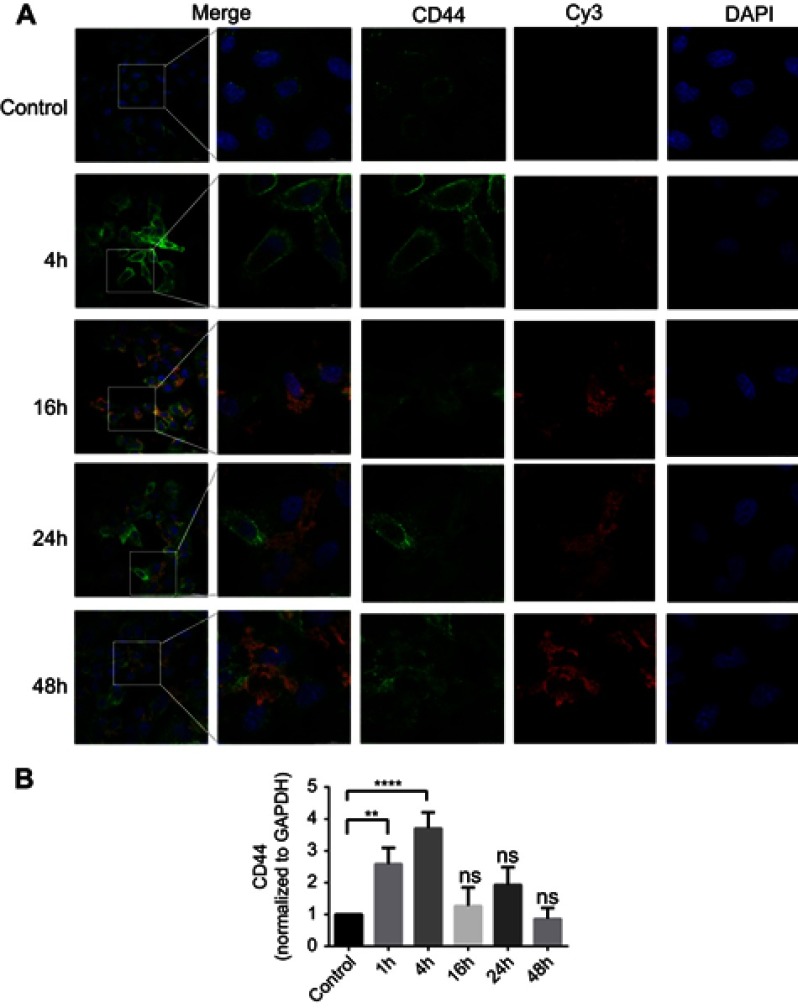
Figure 4.
(A) Changes in the fluorescence intensity of sCS NPs-HA and receptor CD44 at different time points. Red, green, and blue fluorescence correspond to sCS NPs-HA, CD44, and nucleus, respectively (amounts of Cy3-labeled siRNA 0.52 μg). (B) CD44 expression changes over time. **P<0.01, ****P<0.0001 (one-way ANOVA (and nonparametric) and t-tests), ns means not statistical significance.

