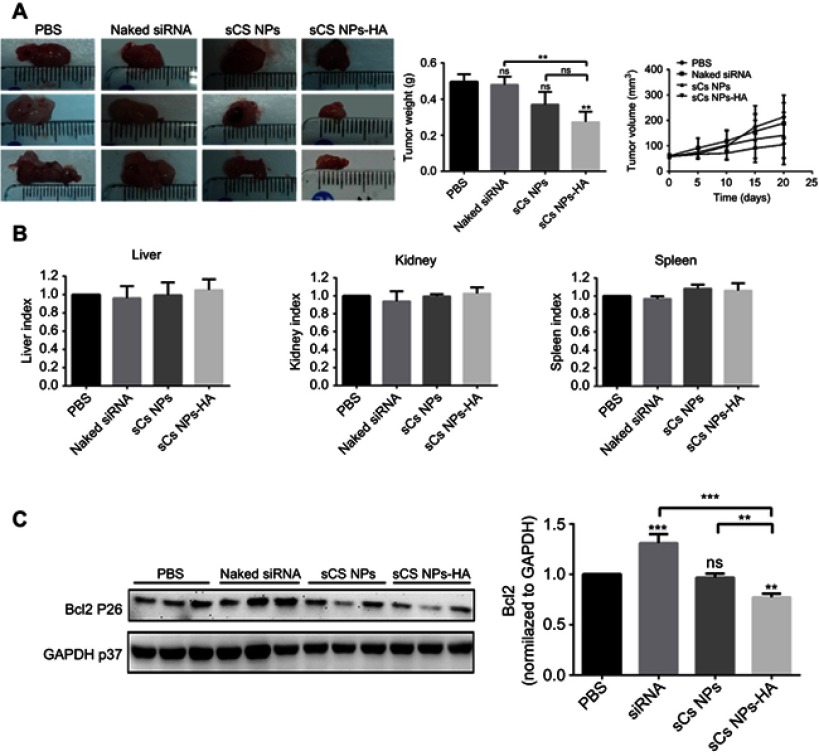
Figure 6.
Effects of sCS NPs-HA on tumor growth, the injection dose of Cy3-labeled siRNA in all experimental groups was 0.16 mg siRNA/kg. (A) Tumors isolated from murine groups PBS, naked Cy3-labeled siRNA, sCS NPs, and sCS NPs-HA. The weight of tumors in the murine sCS NPs-HA group was significantly lower as compared with the PBS group. **P<0.01 (one-way ANOVA (and nonparametric) and t-tests), ns means not statistical significance. The tumor growth inhibition graph showed that the growth of subcutaneous tumor volume in the sCS NPs-RNA group was significantly inhibited. (B) The indices (weight ratios) of liver, kidneys, or spleen to the body weight for all groups (n≥3). There were no statistically significant differences between the control and any experimental groups, P>0.5 (one-way ANOVA (and nonparametric)). (C) Expression levels of the BCL2 protein in the tumors from mice, as determined by Western blotting and normalized to GAPDH expression. Data are presented as mean ± SD of three experiments. **P<0.01, ***P<0.001, ****P<0.0001 (one-way ANOVA (and nonparametric) and t-tests).

