
Figure 3. A20 robustly and ABIN1 weakly represses TNFα induced inflammatory transcriptional programs.
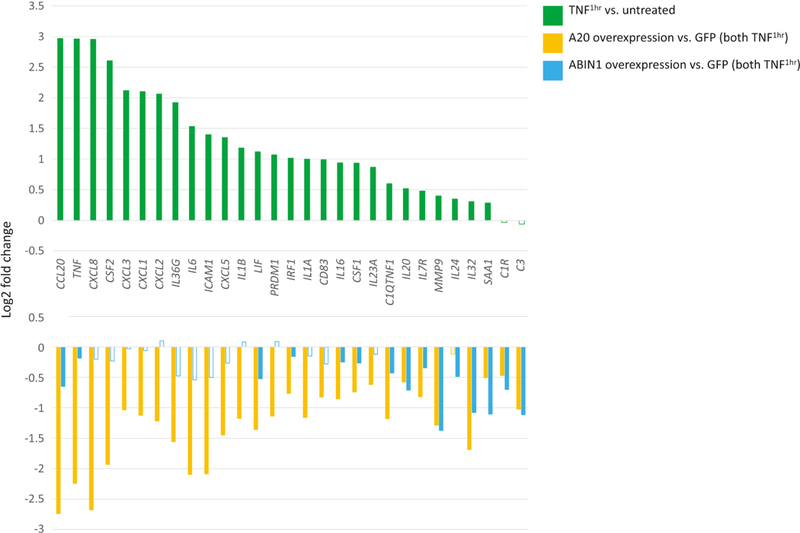
Top panel depicts relative expression (log2 fold change) of mock infected (GFP) keratinocytes incubated with TNFα for 1 hour versus untreated mock infected keratinocytes. Bottom panel depicts relative expression (log2 fold change) for either A20 or ABIN1 overexpressing keratinocytes compared to mock infected (GFP) keratinocytes, all samples treated with TNFα for 1 hour. Data shown represents edgeR RNA-seq differential expression results for 6 replicates for each permutation (FDR < 0.05 except for non-shaded bars).